
Tendencias en la precipitación diaria de la cuenca alta Laja-Peñuelitas, Guanajuato
DOI:
https://doi.org/10.29312/remexca.v12i7.2919Palabras clave:
RClimDex, homogeneización, cambio climáticoResumen
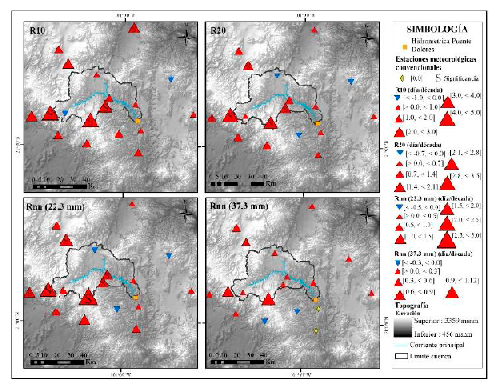
Detectar cambios en el comportamiento de la precipitación, temperatura o cualquier variable atmosférica es fundamental para los tomadores de decisiones. El identificar tendencias en el comportamiento histórico de las estaciones meteorológicas brinda información para el comportamiento futuro del clima. El presente trabajo analiza los cambios en los extremos de precipitación en la cuenca alta Laja-Peñuelitas en el estado de Guanajuato, utilizando los índices de cambio climático desarrollados por el equipo de expertos en detección e índices de cambio climático. Se analizó un periodo de 36 años (1982-2017) utilizando datos diarios de precipitación, seleccionando estaciones meteorológicas convencionales con menos de 25% de datos perdidos, sometiendo estas bases de datos a un proceso de control de calidad de datos y homogeneización, obteniendo 11 índices de precipitación a través del programa RClimDex. Los resultados muestran una tendencia estadística no significativa (62.09%) y significativa ascendente (14.05%), indicando que en la cuenca alta Laja-Peñuelitas, es posible establecer el mantenimiento y ligero aumento en el comportamiento y cantidad de la precipitación.
Descargas
Citas
Adger, W. N.; Arnell, N. W. and Tompkins, E. L. 2005. Adapting to climate change: perspectives across scales. Global Environmental Change. 15(2):75-76. https://doi.org/10.1016/ j.gloenvcha.2005.03.001.
Arriaga, R. S. and Cavazos, T. 2010. Regional trends of daily precipitation indices in northwest México and southwest united states. J. Geophys. Res. 115(D14):1-10. https://doi.org/10.1029/2009jd013248.
INEGI. 1998. Conjunto de datos vectoriales de la carta edafológica, escala 1:250 000, serie i. Instituto Nacional de Estadística y Geografía. Aguascalientes, México. https://www.inegi.org.mx/app/biblioteca/ficha.html?upc=702825234621.
INEGI. 2008. Conjunto de datos vectoriales, unidades climáticas, escala 1:1 000 000. Instituto Nacional de Estadística y Geografía. Aguascalientes, México. https://www.inegi.org.mx/ app/biblioteca/ficha.html?upc=702825267568.
INEGI. 2010. Siatl: simulador de flujos de agua de cuencas hidrográficas 3.2. Instituto Nacional de Estadística y Geografía. http://antares.inegi.org.mx/analisis/red-hidro/siatl/#
INEGI. 2016. Conjunto de datos vectoriales de uso del suelo y vegetación, escala 1:250 000, serie VI (Capa Unión). Instituto Nacional de Estadística y Geografía. Aguascalientes, México. https://www.inegi.org.mx/app/biblioteca/ficha.html?upc=889463598459.
Kachok, R. e Ivanova, A. 2019. Índices de cambio climático en la reserva de la biosfera El Vizcaíno, Baja California Sur, México (1960-2012). Rev. Brasil. Climatol. 24(15):67-93.
Kotlarski, S.; Szabó, P.; Herrera, S.; Räty, O.; Keuler, K.; Soares, P. M.; Cardoso, R. M.; Bosshard, T.; Pagé, C.; Boberg, F.; Gutiérrez, J. M.; Isotta, F. A.; Jaczewski, A.; Kreienkamp, F.; Liniger, M. A.; Lussana, C. and Pianko, K. 2017. Observational uncertainty and regional climate model evaluation: a pan-European perspective. Inter. J. Climatol. 39(9):3730-3749. https://doi.org/10.1002/joc.5249.
Martínez, A. P. F. y Patiño, G. C. 2012. Efectos del cambio climático en la disponibilidad de agua en México. Tecnología y Ciencias del Agua. 3(1):5-20.
Núñez, G. G. y García, S. J. 2018. Análisis de la calidad de datos y la tendencia de algunos índices de precipitación en el estado de Jalisco. Rev. Internac. Estadís. Geograf. 9(2):14-27.
Persson, G.; Bärring, L.; Kjellström, E.; Strandberg, G. and Rummukainen, M. 2007. Climate indices for vulnerability assessments. Swedish Meteorological and Hydrological Institute. S-601 76 Norrköping, Sweden. Report RMK Num. 111. 64 p.
Prieto, G. R.; Avendaño, G. M. A. y Matías, R. L. G. 2010. Tormentas severas. In: serie fascículos. Centro Nacional de Prevención de Desastres-Secretaría de Seguridad y Protección Ciudadana. 1a (Ed). Ciudad de México. 54 p.
SMN. 2019. Base de datos climatológica. Servicio Meteorológico Nacional. https://smn.conagua.gob.mx/.
Vázquez, A. J. L. 2010. Guía para el cálculo y uso de índices de cambio climático en México. Instituto Nacional de Ecología- Secretaría de Medio Ambiente y Recursos Naturales. 1a (Ed.). México, DF. 88 p.
Velasco, H. M.; Morales, A. T.; Estrella, C. N. G., Díaz, R. R.; Juárez, S. J. P.; Hernández, V. M. y Bernal, M. R. 2015. Tendencias y variabilidad de índices de cambio climático: enfoque agrícola en dos regiones de México. Rev. Mex. Cienc. Agríc. 6(7):1587-1599.
Wang, X. L. and Feng, Y. 2013. RHtests-dlyPrcp user manual. Climate research division, atmospheric science and technology directorate, science and technology branch, environment Canada. Toronto, Ontario, Canada. 17 p.
Yan, G.; Qi, F.; Wei, L.; Aigang, L.; Yu, W.; Jing, Y.; Aifang, C.; Yamin, W.; Yubo, S. and Qianqian, M. 2014. Changes of daily climate extremes in loess plateau during 1960-2013. Quaternary International. 1-17. https://doi.org/10.1016/j.quaint.2014.08.052.
Zarazúa, V. P.; Ruiz, C. J. A.; Ramírez, O. G.; Medina, G. G.; Rodríguez, M. V. M.; De la Mora, O. C.; Flores, L. H. y Durán, P. N. 2014. Índices de extremos térmicos en las llanuras costeras del Golfo Sur en México. Rev. Mex. Cienc. Agríc. (10):1843-1857.
Zhang, X.; Alexander, L.; Hegerl, G. C.; Jones, P.; Tank, A. K.; Peterson, T. C.; Trewin, B. and Zwiers, F. W. 2011. Indices for monitoring changes in extremes based on daily temperature and precipitation data. Wires climate change. 2(6):851-870. https://doi.org/ 10.1002/wcc.147.
Zhang, X., and Yang, F. 2004a. RClimDex (1.0) manual del usuario. (Traduc.). Santos, J. L. Centro internacional para la investigación del fenómeno del Niño Ciifen. Guayaquil, Ecuador. 22 p.
Zhang, X. y Yang, F. 2004b. Rclimdex (1.0) user manual. Climate Research Branch, Environment Canada. Downsview, Ontario, Canada. 23 p.
Zittis, G. 2017. Observed rainfall trends and precipitation uncertainty in the vicinity of the Mediterranean, middle East and North Africa. Theor. Appl. Climatol. 134(3-4):1207-1230. https://doi.org/10.1007/s00704-017-2333-0.}
Descargas
Publicado
Cómo citar
Número
Sección
Licencia
Derechos de autor 2021 Revista Mexicana de Ciencias Agrícolas

Esta obra está bajo una licencia internacional Creative Commons Atribución-NoComercial 4.0.
Los autores(as) que publiquen en Revista Mexicana de Ciencias Agrícolas aceptan las siguientes condiciones:
De acuerdo con la legislación de derechos de autor, Revista Mexicana de Ciencias Agrícolas reconoce y respeta el derecho moral de los autores(as), así como la titularidad del derecho patrimonial, el cual será cedido a la revista para su difusión en acceso abierto.
Los autores(as) deben de pagar una cuota por recepción de artículos antes de pasar por dictamen editorial. En caso de que la colaboración sea aceptada, el autor debe de parar la traducción de su texto al inglés.
Todos los textos publicados por Revista Mexicana de Ciencias Agrícolas -sin excepción- se distribuyen amparados bajo la licencia Creative Commons 4.0 atribución-no comercial (CC BY-NC 4.0 internacional), que permite a terceros utilizar lo publicado siempre que mencionen la autoría del trabajo y a la primera publicación en esta revista.
Los autores/as pueden realizar otros acuerdos contractuales independientes y adicionales para la distribución no exclusiva de la versión del artículo publicado en Revista Mexicana de Ciencias Agrícolas (por ejemplo incluirlo en un repositorio institucional o darlo a conocer en otros medios en papel o electrónicos) siempre que indique clara y explícitamente que el trabajo se publicó por primera vez en Revista Mexicana de Ciencias Agrícolas.
Para todo lo anterior, los autores(as) deben remitir el formato de carta-cesión de la propiedad de los derechos de la primera publicación debidamente requisitado y firmado por los autores(as). Este formato debe ser remitido en archivo PDF al correo: revista_atm@yahoo.com.mx; revistaagricola@inifap.gob.mx.
Esta obra está bajo una licencia de Creative Commons Reconocimiento-No Comercial 4.0 Internacional.