elocation-id: e4247
The percentage of polyembryonic seeds and the number of embryos per seed (NE) are variables commonly used to estimate the degree of polyembryony in citrus, a characteristic used as an indicator of clonal or vegetative propagation of selected genotypes. However, many studies omit the description of the methods used to determine the appropriate sample size in the quantification of these variables. The purpose of this work was to propose a robust statistical methodology for calculating the optimal sample size in polyembryonic studies in citrus using the maximum distance method and the F-test. Five citrus genotypes (C-35 citrange, Volkamer lemon, Amblicarpa mandarin, Valencia orange and Mineola tangelo) were evaluated over two harvest cycles (2020 and 2021) by counting the number of embryos in 100 seeds per genotype. Since the variable of the number of embryos per seed was not normally distributed, the maximum distance method was applied using coefficients of variation calculated with the winsorized mean and a nonparametric bootstrap procedure. The results indicated optimal sample sizes of 26 to 28 seeds, with coefficients of variation of 6% to 11%, depending on the genotype. It was concluded that, for the genotypes evaluated, analyzing samples of up to 50 seeds is sufficient to estimate the degree of polyembryony accurately.
apomixis, citrus, maximum distance method, nonparametric bootstrap.
Polyembryony in citrus is a characteristic of great agronomic relevance, as it allows the obtaining of plants genetically identical to the mother plant through seeds, which constitutes a strategic advantage for the commercial propagation of selected genotypes (Duarte et al., 2013). This type of asexual reproduction, known as sporophytic adventitious apomixis, originates from the nucellar tissue of the ovary and results in the formation of somatic embryos that coexist with the zygotic embryo within the same seed (Martínez-Ochoa et al., 2012). As a result, the germination of nucellar embryos allows the genotype’s genetic identity to be preserved, whereas the occasional emergence of sexual embryos can generate genetic segregation.
In addition to its genetic importance, propagation by polyembryonic seeds offers operational advantages over other vegetative methods, such as reducing the risk of pathogen transmission and facilitating the transport and handling of plant material between regions or countries (Andrade-Rodríguez et al., 2003; Kishore et al., 2012; Villegas-Monter et al., 2023). For these reasons, polyembryony has been widely studied in citrus, particularly through two key variables: the percentage of polyembryonic seeds and the number of embryos per seed, which are used as indicators of the clonal propagation potential of the genotypes evaluated (Martínez-Ochoa et al., 2012; Duarte et al., 2013).
Nonetheless, despite the abundance of studies on polyembryony in citrus, most do not explicitly report the methodology employed to determine the sample size used for quantifying these variables. Highly variable sample sizes are observed in the literature, ranging from 100 to 1 000 seeds, without clear statistical justification (Andrade-Rodríguez et al., 2003; Darlan-Ramos et al., 2006; Kishore et al., 2012). This omission limits the reproducibility of studies and can lead to inefficient use of experimental resources.
Some studies have tried to address this problem by estimating the sample size from the coefficient of variation, using the maximum curvature method. Such is the case of Santos et al. (2015) in citrus and Arellano-Durán et al. (2018) in mango. Nevertheless, these approaches are based on assumptions of normality and the use of the arithmetic mean as an estimator of central tendency, which may be inappropriate when the data present asymmetric distributions or outliers, a common condition in biological variables such as the number of embryos per seed (Leys et al., 2013).
The proper determination of the sample size is a fundamental element of experimental design, since it allows optimizing the accuracy of the estimates and the use of available resources (Avanza et al., 2010). Traditionally, this calculation is based on dispersion measures relative to the arithmetic mean; however, when the data do not meet the normality assumption, the meaning can be strongly influenced by extreme values, which distorts the estimation of the coefficient of variation and consequently, the required sample size.
In this scenario, the use of robust and nonparametric statistical methods represents a suitable alternative for analyzing variables with asymmetric behavior. These methods include winsorization, which reduces the influence of outliers on central tendency and dispersion estimators (Barnett and Lewis, 1994) and the nonparametric bootstrap, which allows estimating population parameters without assuming a specific theoretical distribution of the data (Efron and Tibshirani, 1986). These techniques have demonstrated their usefulness in biological and agronomic studies with high variability (Martínez-Ochoa et al., 2012).
In this context, the study aimed to propose a robust statistical methodology to estimate the optimal sample size in citrus polyembryonic studies, particularly when the variable of the number of embryos per seed does not meet the normal assumption. To this end, five citrus genotypes were evaluated and the maximum distance method was applied, using winsorized coefficients of variation estimated by a nonparametric bootstrap, complemented by an F-test to validate the selected sample size objectively.
Ten mature fruits per genotype were collected from open-pollinated trees of the following citrus: Valencia orange (Citrus sinensis (L.) Osbeck), Mineola tangelo (C. paradisi Macf. × C. reticulata Blanco), C-35 citrange (C. sinensis × Poncirus trifoliata), Volkamer lemon (C. volkameriana Pasq.) and Amblicarpa mandarin (C. amblycarpa (Hassk.) Ochse). The collection was carried out during two consecutive production cycles (2020 and 2021) in groves of the ‘Cazones’ nursery, Veracruz, Mexico (20°42’ north latitude; 97°18’ west longitude; 23 masl).
Ten viable seeds were randomly selected from each fruit, forming a pre-sample of 100 seeds per genotype and per cycle. The sampling unit was a seed. Each seed had the testa and tegmen manually removed to expose the embryos, which were separated and counted individually to record the number of embryos per seed (NE).
The normality of the NE variable was assessed using the Kolmogorov-Smirnov test, and the presence of outliers was identified using box plots. Since the variable did not meet the assumption of normality and exhibited extreme values, the use of the arithmetic mean as an estimator of central tendency to determine the sample size was discarded. All statistical analyses were performed using SAS software (SAS Institute, 2003).
The winsorized coefficient of variation was estimated by bootstrap () from the winsorized mean () and the winsorized standard deviation (). To this end, B = 200 nonparametric bootstrap replicates were generated, according to Efron and Tibshirani (1986); Ramírez et al. (2013), in order to accurately calculate the () in each genotype. 1) B independent bootstrap samples were generated, obtained with replacement from the original dataset ; 2) the bootstrap replicates of the estimator corresponding to each sample were evaluated: from b = 1, ⋯, B; and 3) was estimated as the average of B replicates of the estimator, using the following expression:
Where: is the winsorized mean;
is the winsorized standard deviation (); n = is the sample size; and α it refers to a proportion of observations to winsorized at each end or either end (0.1, 0.2). According to Erceg and Mirošević (2008), a winsorization of 20% was applied, replacing 10% of the values at each end with the values closest within the remaining range. In the following expression, this criterion was applied to estimate the winsorized variance and consequently, the coefficient of variation:
Where: is the winsorized variance and B is the number of replicates; when B → ∞, the bootstrap estimator of the winzorized coefficient of variation converges to the ideal boostrap estimator: , implying that converges to .
Winsorized coefficients of variation (CVw) were estimated for different sample sizes and plotted as a function of n. A power model of the form: y = ax-b, proposed by Lessman and Atkins (1963), was fitted. Where a and b are estimated parameters. Based on this fit, the maximum curvature criterion defines the optimal sample size as the point on the curve at which additional increments of n do not generate relevant reductions in the winsorized coefficient of variation (CVw). The location of this point can be carried out by visual inspection, a subjective procedure, or objectively using the maximum distance method (MDM) (Paranaiba et al., 2009). In this study, MDM was applied as described by Lorentz et al. (2012) (Figure 1).
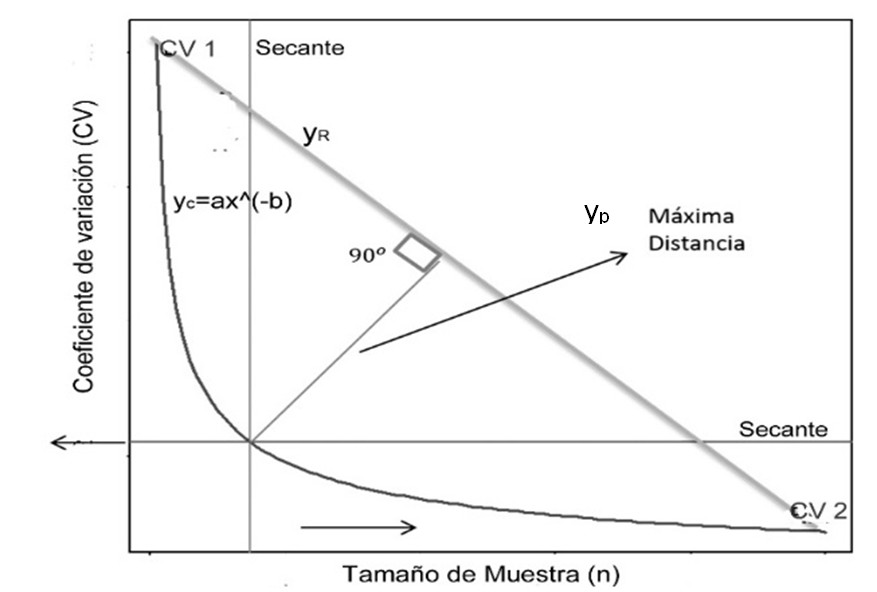
The MDM identifies the optimal sample size as the point of the fit curve yc, described by the function y = ax-b; that is yc = ax-b, that maximizes the distance from a secant line yr drawn between two points of the same curve. To do this, a line yp = ex + f, perpendicular to the secant line yr, is defined, which intersects the curve yc at the point where this distance is maximum, corresponding to the optimal sample size.
The secant line yr was defined from the points by (xcri, ycri) and by (xcrf, ycrf). Its angular coefficient c was calculated as: c = (ycrf - ycri)/(xcrf - xcri), and the linearity coefficient d was obtained from the equation of the line d = ycri - cxcri or d = ycrf - cxcrf. The angular coefficient e of the perpendicular line yp was determined by the condition of perpendicularity between the two lines: e = -1/c. This procedure allowed us to objectively identify the point of maximum distance between the curve yc and the line yr, which represents the point of maximum curvature and, therefore, the optimal sample size.
The linear coefficient f of the line yp was obtained using the interactive procedure described by Lorentz et al. (2012), based on: xrpj = (f - d)/(c - e). The distance between the points (xcj, ycj) and (xrpj, yrpj), located on the line ypj, perpendicular to yr, was calculated as:
Based on the above, the procedure for applying the MDM was as follows: 1) values were taken on the x-axis, between the interval [xcri, xcrf] and a spacing Δx = (xcrf - xcri)/n. Where: n is the number of intervals into which the domain of the function was divided; 2) for each x value (with j = 1,...,n), yc(xj) was calculated, setting yc(xj) = yp(xj); that is, the line yp, perpendicular to the line yr, intersects the curve yc at xj; 3) the values yc(xj) and yp(xj) were named ycj y ypj, respectively; 4) the coefficient f was obtained by substituting the point (xj, ypj) into the equation of yp, so that f = ypj - exj; 5) the point of intersection (xrpj, yrpj) between the lines yr and ypj was determined by solving the system yrpj = cxrpj + d; yrpj = exrpj + f, whose solution is: xrpj = (f - d)/(c - e); and 6) the distance between (xcj, ycj) and (xrpj, yrpj) was calculated. This procedure was repeated for j = 1, ⋯, n in the entire interval [xci, xcf]; and the maximum value dcrmáx and the corresponding coordinates xcmáx, ycmáx were identified. The value dcrmáx was considered the maximum distance between the curve yc and the line yr, measured on a segment perpendicular to yr. The point (xcmáx, ycmáx) determined the optimal sample size.
As a complementary criterion, an F-test was used to assess the homogeneity of variances across consecutive sample sizes. This test was based on comparing absolute variances, since in the experimental design, the primary interest is to minimize the experimental error, represented by variance (Gómez and Gómez, 1984). The F-statistic was calculated as the quotient of two consecutive variances. The hypotheses proposed were: Ho: Var(x)i = Var(x)j vs H1: Var(x)i ≠ Var(x)j, for all i ≠ j. With a significance level α = 0.05, Ho was rejected when p < 0.05. In cases where no significant differences were detected between consecutive variances, further increases in sample size were not considered to produce significant reductions in variability.
The variable of the number of embryos per seed (NE), evaluated in five citrus genotypes during the 2020 and 2021 harvest cycles, did not meet the assumption of normality according to the Kolmogorov-Smirnov test (p ≤ 0.05). In all genotypes, positive asymmetric distributions were observed, characterized by a high dispersion of NE relative to its meaning in each genotype. This distribution pattern is consistent with that reported for polyembryonic species, in which the formation of nucellar embryos is regulated by one or a few genes, but may be modulated by environmental and physiological factors that increase intraspecific variability (Andrade-Rodríguez et al., 2003; Kepiro and Roose, 2010). In particular, in the Mineola tangelo genotype, maximum values of up to 13 embryos per seed were recorded, even though the mean was around four embryos, indicating a marked dispersion relative to the arithmetic mean.
The exploratory analysis allowed us to identify outliers in all genotypes evaluated. In Amblicarpa, C-35 and Mineola, seeds with more than nine embryos were considered atypical, while in Valencia and Volkamer, this threshold corresponded to eight and seven embryos, respectively. The systematic presence of these extreme values confirms that the arithmetic mean does not constitute a robust estimator of NE, as pointed out by Leys et al. (2013) for variables with asymmetric distributions.
As a consequence of this data structure, the coefficients of variation calculated from the arithmetic mean, without applying robust methods, were high and ranged from 35% to 63% across genotypes and harvest cycles. These values reflect a high relative variability of NE and limit their usefulness as a reliable criterion for determining the sample size. The application of winsorization made it possible to substantially reduce the influence of extreme values on the estimation of variability. When using the winsorized mean, the coefficients of variation were consistently reduced in all genotypes. For example, in Valencia, the coefficients of variation decreased from 35% and 50% to values between 19% and 28%; in Mineola, from 41-43% to 34-38%; in C-35, from 44% to 24-28%; in Volkamer, from 52-63% to 24-30%, and in Amblicarpa, from 41-46% to 25-26%, considering both evaluation cycles. These results are consistent with the point made by Barnett and Lewis (1994), who highlight the usefulness of robust estimators to control for variability induced by outliers.
The winsorized coefficients of variation of the number of embryos per seed (NE) were estimated by nonparametric bootstrap with replacement, using 200 replicates, and are presented in Table 1 and 2 for the 2020 and 2021 cycles, respectively; this approach made it possible to quantify the variability of NE without assuming a theoretical distribution, which is appropriate for biological variables with asymmetric behavior (Efron and Tibshirani, 1986; Davison and Hinkley, 1997).
The choice of 200 replicates was justified by the variation in the coefficient of variation between genotypes and cycles and is within the recommended range to obtain stable estimates of standard error and variance estimators in contexts of high variability (Efron and Tibshirani, 1986; Ramírez et al., 2013). A progressive decrease in the coefficient of variation was observed in all genotypes as the sample size increased (Table 1 and 2), with pronounced reductions to approximately 20 seeds and an asymptotic trend from sample sizes close to 60-70 seeds. This behavior is characteristic of uniformity trials used to define optimal sample sizes in agronomic studies (Lessman and Atkins, 1963; Paranaiba et al., 2009).
The application of MDM allowed us to objectively identify the point of maximum curvature of the relationship between the winsorized coefficient of variation and the sample size, thereby avoiding the subjectivity associated with the visual inspection of the traditional maximum curvature method (Paranaiba et al., 2009; Arellano-Durán et al., 2018). Based on this criterion, the estimated optimal sample size for the five genotypes, considering both harvest cycles, was within a range of 26 to 28 seeds. In these sample sizes, the coefficients of variation ranged from 6.01% to 11%, indicating controlled variability and adequate accuracy in estimating NE.
In previous studies that employed the maximum curvature method to determine sample size in polyembryonic species, Santos et al. (2015) reported a range of 10 to 23 seeds in 15 citrus genotypes, whereas Arellano-Durán et al. (2018) recommended testing eight polyembryonic seeds in Manila and Ataulfo mango cultivars. However, in both cases, it is not specified whether the data complied with the assumption of normality, a necessary condition to justify the use of the coefficient of variation as an estimation criterion.
Additionally, the F-test applied as a complementary criterion for validating the sample size showed that, in most genotypes, no significant differences were detected between consecutive variances from sample sizes between 30 and 50 seeds, depending on the genotype and the harvest cycle. In particular, no significant differences were observed in Valencia from 30 seeds, in Volkamer from 50 seeds, and in Amblicarpa, C-35, and Mineola from 40 seeds. These results indicate that additional increases in sample size do not produce significant reductions in absolute variability, which aligns with Gómez and Gómez (1984).
Overall, the MDM allowed us to identify an optimal sample size between 26 and 28 seeds, while the F-test suggested slightly wider ranges (30-50 seeds), depending on the genotype; this convergence between criteria supports the robustness of the approach and provides an objective framework for selecting sample sizes in citrus polyembryonic studies. Based on both results and considering the stability observed in two harvest cycles, it is recommended to analyze 27-40 seeds in Amblicarpa, 26-50 in Volkamer, 26-30 in Valencia, and 26-40 in C-35 and Mineola. In this sense, the proposed method represents a robust alternative for variables that do not comply with normality, since defining adequate sample sizes improves the accuracy of the estimators, strengthens the reliability of the inferences, and can be extrapolated to other species and quantitative variables with asymmetric distributions, expanding its usefulness in different experimental contexts.
The results of this study show that winsorization, combined with a nonparametric bootstrap procedure, is an effective strategy for estimating the sample size in citrus polyembryonic studies, particularly when the variable of the number of embryos per seed presents asymmetry and outliers. The application of the maximum distance method, complemented by the F-test, enabled us to objectively define that a sample size between 26 and 50 seeds is sufficient to obtain accurate estimates with controlled variability in the five genotypes evaluated. Overall, the proposed methodology contributes to the standardization of sampling in polyembryonic citrus seeds and offers a replicable procedure for other species and quantitative variables with non-normal distributions.
Villegas-Monter, A.; Martínez-Ochoa, E. D. C.; Andrade-Rodríguez, M. and Villegas-Velásquez, I. 2023. Citrus polyembryony. In: Gonzatto-Pereira, M. and Santos, J. S. (Eds.). Advances in citrus research horticultural and human health aspects. London, UK. 1-15 pp. http://dx.doi.org/10.5772/intechopen.105994.