elocation-id: e4244
The phenological characterization of black bean varieties generated by the Bean Program of the National Institute of Forestry, Agricultural and Livestock Research for southeastern Mexico is conducted by quantifying the number of days after sowing required to reach the different stages of development. This characterization is imprecise for contrasting environments. This study aimed to characterize nine advanced lines and two varieties of opaque black beans by using the number of days after sowing and the index of growing degree-days necessary to achieve the stages of flowering and physiological maturity and to compare the accuracy of the number of days after sowing and the growing degree-days to predict phenology. The number of days after sowing and the growing degree-days required by the genotypes to reach the flowering and physiological maturity stages were quantified across nine environments in southeastern Mexico. The ability of five mixed models was evaluated, considering the number of days after sowing, growing degree-days and environment as fixed effects and genotype as a random effect, to predict the phenological stages of the lines and varieties. Four lines were earlier than Negro Grijalva (1 892 growing degree-days), with an average of 1 859 growing degree-days; in contrast, four others obtained an average of 1 902 growing degree-days, higher than Negro Grijalva but lower than Negro Comapa (1 920 growing degree-days) and only one line was later than both varieties (1 976 growing degree-days). The best model for predicting phenology was the one that considered only the growing degree-days, regardless of the environment. It was concluded that growing degree-days are more accurate than the number of days after sowing for predicting the flowering and physiological maturity of the genotypes in the different evaluation environments.
Phaseolus vulgaris L., canopy temperature, heat units, stages of crop development
In the Bean Program of the Cotaxtla Experimental Field (CECOT), by its Spanish acronym, belonging to the National Institute of Forestry, Agricultural and Livestock Research (INIFAP), by its Spanish acronym, improved varieties of black beans are developed for the tropical and subtropical areas of southeastern Mexico, mainly for the states of Veracruz and Chiapas. The selection is oriented to the predominant systems: summer rainfed sowing and autumn-winter sowing with residual moisture. Therefore, candidate genotypes should show adaptation and preferably be early to intermediate cycle to reduce the risk of terminal drought (Tosquy et al., 2014), tolerant to the primary fungal and viral diseases and of commercial quality in accordance with the regional preference for opaque and small black grain (FIRA, 2016). To integrate these attributes, germplasm from various origins is incorporated, and a stepwise selection process is applied in order to identify lines with potential for commercial release.
Phenology is described using days after sowing (DAS) from emergence (V0) until the crop reaches a defined stage. In beans, flowering and physiological maturity, as determined by the first open flower and by the change in pod color, respectively (Fernández, 1986), are key stages for grain yield. However, the DAS required by the same genotype varies across environments, limiting its ability to compare responses and anticipate phenological performance under contrasting conditions. An alternative is the use of thermal time, which links development to temperature above a base temperature (Bonhomme, 2000).
Growing degree-days (GDDs) are the most widely used index for quantifying thermal time (Ahmad et al., 2017). It has been suggested that using canopy temperature, rather than air temperature, can improve phenological simulation (Neukam et al., 2016). Evaluating the usefulness of GDDs compared to DAS provides a basis for forecasting critical stages, planning management practices and strengthening decision-making in the selection and release of varieties (Paleari et al., 2020).
The objective of the present study was to characterize a group of black bean genotypes by the number of DAS and GDDs required to reach the flowering and physiological maturity stages in tropical areas of Veracruz and Chiapas, Mexico, as well as to determine the ability of GDDs to predict the time to reach these two phenological stages in comparison to DAS.
The study analyzed the average values of days after sowing (DAS) to the beginning of flowering and physiological maturity of nine advanced lines of opaque and small black beans, generated by the National Bean Program of INIFAP: three derived from Negro Citlali/XRAV-187-3, three from Negro Papaloapan/SEN 46, and three from Jamapa Plus/XRAV-187-3. The Negro Grijalva and Negro Comapa varieties were also included because of their adaptation and performance in tropical areas (Villar et al., 2009; López et al., 2012). The data came from a uniform yield trial conducted in nine environments: three in Chiapas and six in Veracruz (Tosquy et al., 2019).
The characteristics of these evaluation environments are shown in Table 1. The climate information used for the thermal calculation was obtained from a global time series with monthly data on average air temperature and total precipitation (1901-2014, spatial resolution 0.5°), with which a grid was formed, and values were interpolated for each site (Willmott and Matsuura, 2005; Willmott and Matsuura, 2009). Canopy height was recorded during phenological evaluations in 10 random plants per genotype and its daily value was estimated by linear regression.
To obtain the number of GDDs required to reach the phenological stages in bean genotypes, the daily temperature of the canopy was used, which was estimated indirectly, as proposed by Seguin and Itier (1983), with the following formula:
Where: Tcanopy= canopy temperature (°C); Tair= air temperature (°C); SRad= solar radiation (MJ m-2); ET = evapotranspiration (mm); and Heicrop= crop canopy height (cm).
[i] ITA-JRC= Agricultural Technological Institute of Juan Rodríguez Clara; CEIXTA= Ixtacuaco Experimental Field; S= summer cycle; AW= autumn-winter cycle; WS= winter-spring cycle; R= rainfed; RM= residual moisture; TD= terminal drought; DL= with application of dolomite lime; Aw0= warm subhumid climate with the driest humidity regime; Aw1= warm subhumid climate with intermediate humidity regime; Aw2= warm subhumid climate with a wetter humidity regime; Cfb= temperate oceanic climate; Cfa= humid subtropical climate.
For each environment, the daily accumulation of growing degree-days (GDDs) was calculated as (canopy temperature-base temperature), with base temperature= 10 °C (Rai et al., 2020) and the GDDs required to achieve flowering and physiological maturity of each genotype were estimated, along with the corresponding DAS. To compare DAS and GDDs as predictors, four mixed models were fitted, considering genotype as a random effect and the following as fixed effects: 1) DAS + environment, 2) DAS, 3) GDDs + environment and 4) GDDs; a null model was included as a reference. The models were compared using the Akaike Information Criterion (AIC) (Akaike, 1998).
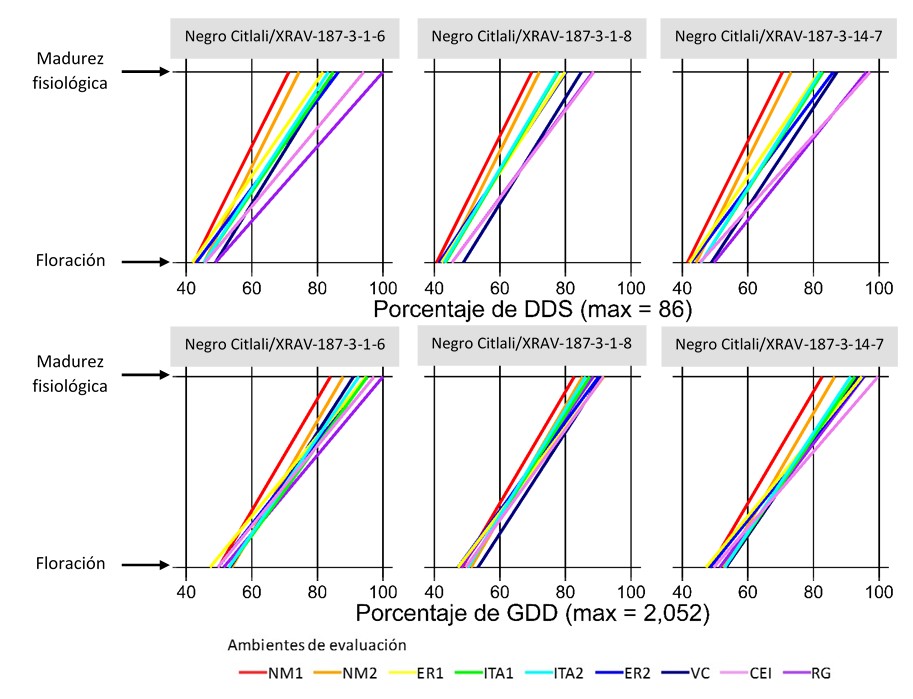
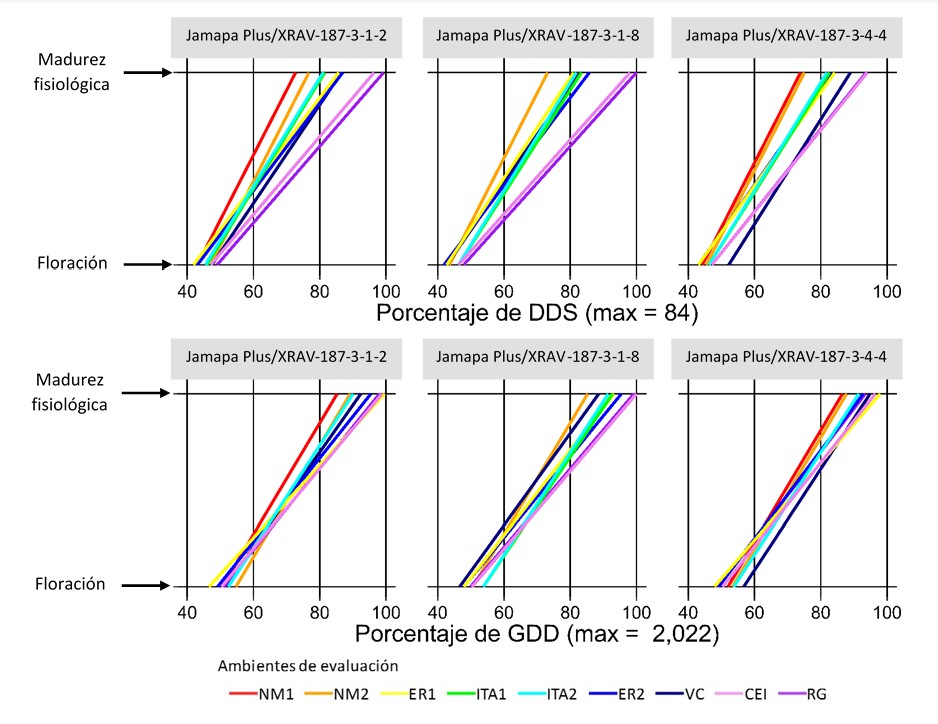
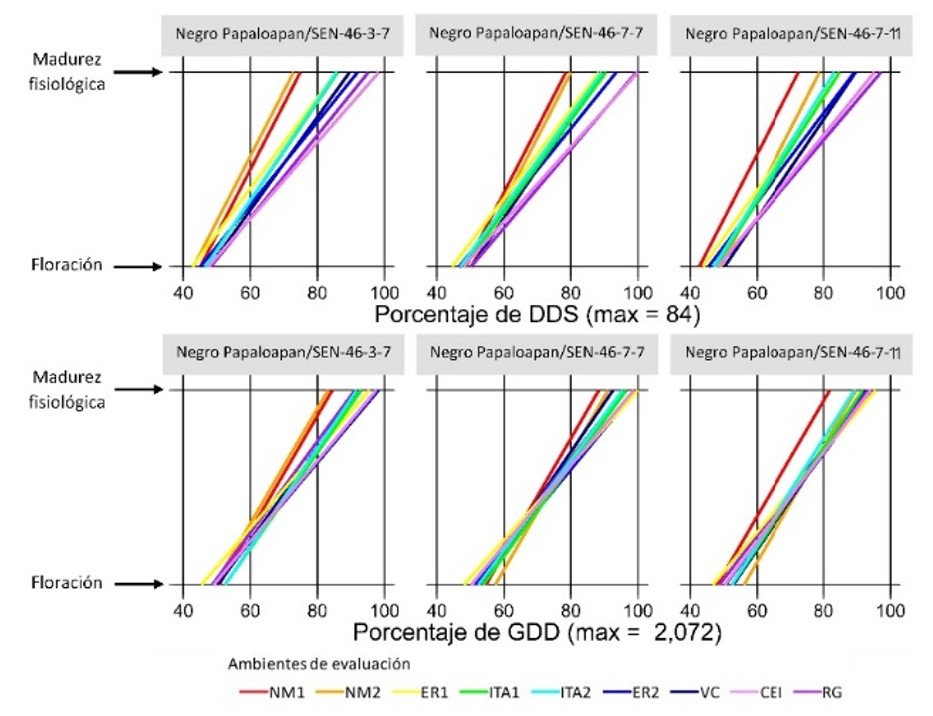
Figures 1 to 4 show, for each advanced line and variety, the DAS and GDDs required to achieve flowering and physiological maturity in the different evaluation environments (Table 1). To facilitate comparison between indices, values are expressed as a percentage of the maximum recorded in DAS and GDDs.
In the Negro Citlali/XRAV-187-3 cross, line 1-8 was the earliest for flowering and maturity, while line 1-6 had the longest time to maturity (Figure 1). In the Jamapa Plus/XRAV-187-3 cross, line 1-8 stood out for its early flowering and 4-4 for the shorter flowering-maturity interval; in contrast, line 1-2 was the later genotype (Figure 2). In Negro Papaloapan/SEN-46, line 3-7 showed the lowest requirements and line 7-7 showed the highest, both in DAS and GDDs (Figure 3).
Among commercial varieties, Negro Grijalva was consistently earlier than Negro Comapa (Figure 4), as documented in previous evaluations (Villar et al., 2009; López et al., 2012). This precocity is agronomically relevant because it is associated with escape from terminal drought in residual-moisture plantings of the autumn-winter cycle (López et al., 2011), a condition that can cause severe yield losses (Tosquy et al., 2014). Together, both varieties ranged from 36-42 DAS (941-1 132 GDDs) to flowering and from 62-85 DAS (1 750-2 029 GDDs) to physiological maturity (Figure 4).
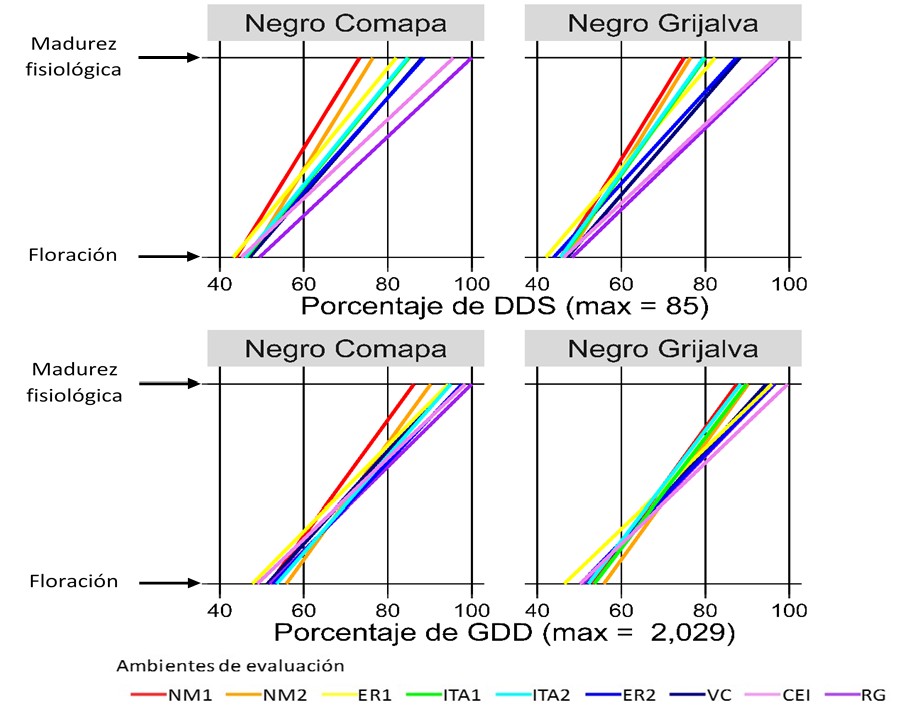
Consistently, DAS showed greater dispersion than GDDs across all genotypes, because GDDs integrate the advance of time adjusted by the crop canopy temperature, a condition that governs phenological development (Neukam et al., 2016). The environment (temperature and humidity regime) strongly influenced the duration of the phenological stages. In general, the variation was greater in the reproductive phase than in the vegetative phase and in environments with moisture deficit during the reproductive stage (ITA1 and ITA2), there was a reduction in time to maturity, consistent with an adaptation/escape mechanism to terminal drought (Tosquy et al., 2014; 2019).
Based on the DAS for the flowering-maturity interval, three groups of environments were distinguished: i) Nuevo México (NM1, NM2), with shorter duration (~63 DAS; 26.5 °C); ii) Ixtacuaco Experimental Field (CEI, by its acronym in Spanish) and Rincón Grande (RG), with longer cycles (~82 DAS; 23.4 and 17.2 °C); and iii) ER1, ER2, ITA1, ITA2 and VC, with intermediate values (~72 DAS; 23.4-26.0 °C). In the locality of El Rubí, ER1 was earlier than ER2 because, in ER1, there were relatively high temperatures during the vegetative phase and water deficit in the reproductive phase, which favored accelerated senescence; in contrast, in ER2, temperatures were lower in the vegetative phase and irrigation was applied, conditions that prolonged development. In environments established on the same date within a site (ITA1-ITA2; NM1-NM2), no noticeable differences were observed.
In contrast, when considering GDDs, such a clear environmental differentiation was not observed (Figures 1-4), probably because this index adjusts development for canopy temperature (estimated from air temperature, solar radiation, and evapotranspiration), compensating for differences between warm/dry and temperate/humid environments. Taken together, this suggests that GDDs are more accurate than DAS in describing phenology across contrasting environments.
The selection of the best predictor using mixed models (Table 2), coincided with this pattern: the model with GDDs as a fixed effect and genotype as a random effect (model 4) presented the lowest AIC (865.6) and the inclusion of the environment did not improve the fit (Akaike, 1998). Although the AIC is a relative criterion and does not test hypotheses, the difference relative to the null model (model 5; AIC= 2 020.8) indicates acceptable predictive capacity and supports the use of GDDs to parameterize phenological development without explicitly incorporating the environment (Weijers et al., 2018).
| Models | Fixed effects | Random effect | AIC |
|---|---|---|---|
| 1 | DAS + evaluation environment | Genotype | 967.79 |
| 2 | DAS | Genotype | 982.42 |
| 3 | GDDs + evaluation environment | Genotype | 891.83 |
| 4 | GDDs | Genotype | *865.6 |
| 5 | 1 | Genotype | 2009 |
Based on the GDD averages (Table 3), Jamapa Plus/XRAV-187-3-1-8 and Negro Citlali/XRAV-187-3-1-8 presented the lowest requirements to achieve flowering. In addition, Negro Citlali/XRAV-187-3-1-8 and Jamapa Plus/XRAV-187-3-4-4 showed the shortest flowering–maturity interval. Only Negro Citlali/XRAV-187-3-1-8 surpassed Negro Grijalva in earliness, a variety with a very early cycle (Villar et al., 2009), so it could be considered an alternative for areas with frequent occurrence of terminal drought (López et al., 2011).
In contrast, Negro Papaloapan/SEN-46-7-7 required the highest number of GDDs for flowering (1 087) and for the flowering-maturity interval (889), higher than that of commercial varieties. At the opposite extreme, Negro Citlali/XRAV-187-3-1-8 registered the lowest requirements and simultaneously, the lowest standard deviations (±41 in flowering and ±80 in maturity), suggesting greater phenological stability; by contrast, SEN-46-7-7 presented high values of variability between environments. The magnitude of the standard deviation is associated with developmental variability in contrasting environments (Salazar-Gutiérrez et al., 2013).
The GDDs showed greater precision in describing the phenology of the genotypes in the different evaluation environments than DAS. The best prediction was obtained with model four, which uses GDDs as a fixed effect and genotypes as a random effect. The results of this study can be used to simulate the development and potential yield of bean genotypes under different environmental conditions, as well as to generate phenological ideotypes for different conditions.
Prior to this, it is convenient to validate the model with data from other experiments. In the tropical and subtropical areas studied, Jamapa Plus/XRAV-187-3-1-8 and Negro Citlali/XRAV-187-3-1-8 required fewer GDDs to reach the flowering stage. Likewise, Negro Citlali/XRAV-187-3-1-8 and Jamapa Plus/XRAV-187-3-4-4 required fewer GDDs to reach the maturation stage.
Information indicates that the length of the reproductive stage is more sensitive to environmental effects than the vegetative stage. The Negro Grijalva variety had a behavior very similar to the general average of GDDs to reach both stages of development, whereas Negro Papaloapan/SEN-46-7-7 was the latest genotype to flower and mature, with a cumulative total of 1 976 GDDs.
Paleari, L.; Vesely, F. M.; Ravasi, R. A.; Movedi, E.; Tartarini, S.; Invernizzi, M. and Confalonieri, R. 2020. Analysis of the similarity between in silico ideotypes and phenotypic profiles to support cultivar recommendation-a case study on Phaseolus vulgaris. L. Agronomy 10(11):1733-20. https://doi.org/10.3390/agronomy10111733.
Tosquy, V. O. H.; Villar, S. B.; Rodríguez, R. J. R.; Ibarra, P. F. J.; Zetina, L. R.; Meza, P. A. y Anaya-López, J. L. 2019. Adaptación de genotipos de frijol negro a diferentes ambientes de Veracruz y Chiapas. Revista Mexicana de Ciencias. Agrícolas. 10(6):1301-1312. https://doi.org/10.29312/remexca.v10i6.1658.