elocation-id: elocation-id: e4238
Coffee production is an important economic activity worldwide, as it generates employment for more than 20 million people engaged in growing, transforming, processing and marketing the product. This research evaluated and compared the environmental performance of agricultural production in three coffee (Coffea arabica) production systems in La Tinaja, Veracruz -coffee with banana (Musa paradisiaca), coffee with mango (Mangifera indica), and full-sun coffee- in 2024. Using the life cycle assessment methodology and the ReCiPe 2016 method (H), the impacts per functional unit of 1 kg of cherry coffee were analyzed, considering the stages of establishment, development, and agricultural management. The results indicated that producing 1 kg of coffee generates global warming of 0.79, 1.05 and 0.44 kg of CO2eq in the full-sun coffee, coffee-banana, and coffee-mango systems, respectively. Direct soil emissions from fertilizer application contributed to most of the categories assessed. The coffee-banana system registered the highest environmental loads, followed by the full-sun coffee system. The coffee-mango system presented the lowest environmental impacts in all categories, proving to be the system with the best environmental performance compared to the systems studied.
agroforestry systems, climate change, environmental impact.
Coffee farming represents a source of income for 25 million small producers, who generate 80% of the world’s coffee production (FAO, 2025). In Mexico, coffee production reached 1 059 000 t in 2023. Chiapas, Veracruz and Puebla contributed 30, 27 and 24%, respectively, to national production (SIAP, 2024).
In Mexico, coffee production is carried out primarily in systems under shade and in full sun. Shade coffee plantations are agroforestry systems, among which traditional rustic and polyculture systems predominate (Moguel and Toledo, 2004).
Shaded coffee plantations are mainly located in high-biodiversity regions, such as Oaxaca, Chiapas and Veracruz (Moguel and Toledo, 2004). In contrast, full-sun coffee systems represent 10% of the country’s farms and are found in areas such as Soconusco (Chiapas) and Xicotepec (Puebla) (Moguel and Toledo, 1999).
Full-sun coffee systems have environmental impacts, such as soil degradation and reduced carbon storage (Mengesha et al., 2026). Agroforestry systems help reduce soil compaction, erosion, and biodiversity loss (Valdés-Velarde et al., 2022). In addition to improving organic matter and nutrient availability, they promote water infiltration and carbon sequestration (Dollinger and Jose, 2018).
This research aimed to evaluate and compare the environmental performance of three coffee production systems with different types of shade (tree species) in Mexico using life cycle assessment (LCA), with the purpose of identifying the systems with the lowest environmental impacts and the main critical points associated with their production.
The research was conducted in the town of La Tinaja, municipality of Emiliano Zapata, in the state of Veracruz, Mexico (north latitude 19° 30’ 57.936” and west longitude 96° 45’ 18.024”), at an altitude of 901 m (INEGI, 2021). At the study site, three systems were evaluated: two traditional polycultures- coffee with mango trees (Mangifera indica) (CM) and coffee with banana plants (Musa paradisiaca) (CB) and a monoculture coffee in full sun (CS).
Life cycle assessment (LCA) allows us to assess the environmental impacts of a product from the acquisition of raw materials, its production, use and final disposal. This methodology is accredited by the International Organization for Standardization (ISO) through the ISO 14040 (ISO, 2006a) and 14044 (ISO, 2006b) standards. The LCA consists of four stages: 1) definition of the objective; 2) life cycle inventory; 3) life cycle impact assessment; and 4) interpretation.
This research aimed to evaluate and compare the environmental performance in three coffee production systems using LCA. In accordance with ISO 14040, the study systems (CS, CB and CM) were defined as product systems. Each system comprises a set of unitary processes, including input entry, agronomic management operations, and associated emissions within the system limits established for analysis.
The boundaries defined were the stages of plantation establishment, plant development (years 1-3), and agricultural management (production and harvesting). The functional unit (FU) defined was 1 kg of fresh, unprocessed cherry coffee.
The research work was conducted in 2024 based on agronomic information collected in coffee production systems in Veracruz in 2023. The inputs used in each stage are presented in Table 1.
[i] Romero-Fernández et al. (2023). The composition of Nitrofoska fertilizer is as follows: N-total: 21%; N-NO3: 11%; N-NH4: 10%; P2O5: 1%; K2O: 21%.
Direct emissions to air, water and soil were estimated using the methodology of Nemecek and Schnetzer (2011). The following were evaluated: ammonia, nitrous oxide (N2O), and nitrogen oxide in air; phosphate and nitrate in groundwater; phosphate and phosphorus in surface water. Soil N2O emissions were calculated using the same methodology (equation 1). Data were obtained from Romero-Fernández et al. (2023) and from the laboratory.
The results were analyzed using the openLCA 2.0 software and the Ecoinvent 3.2 database. Environmental impacts were assessed with the ReCiPe 2016 (H) method at the midpoint level (Huijbregts et al., 2017).
LCA allows us to identify the environmental impacts and the processes that generate them most in the evaluated systems. Table 2 shows the results for the impact categories using the ReCiPe 2016 (H) method across the study systems.
The results showed that the CB system had the highest environmental loads, followed by CS, whereas CM had the lowest values in all categories.
Similarly, Acosta-Alba et al. (2020) evaluated the environmental impact on three coffee production systems and reported that crop diversification and shade type may be influencing the environmental assessment of coffee.
Factors such as yield and fertilization contribute to environmental impacts. Alishah et al. (2019) observed that environmental impacts per unit of product decreased as yield increased. In coffee crops, NPK fertilizer use and nitrogen fertilization were the primary contributors to the environmental categories (Rahmah et al., 2022; Pazmiño et al., 2024).
In this research, the CM system had the lowest environmental impacts, which may be related to yield, fertilization doses and its positive performance on soil fertility. This is consistent with reports by Romero-Fernández et al. (2023), who observed that the CM system favored soil fertility, improved soil properties, increased nutrient concentrations in leaves and fruits, and promoted higher yields than CS and CB (Table 1).
In contrast, the CB system exhibited the greatest environmental damage in most of the categories measured by LCA (Table 2). In agroforestry systems, Parra-Paitan and Verburg (2022) linked negative results to lower yields. In this study, the CB system outperformed the CS system in productivity at the same fertilization dose.
The difference between the CB system and the other study systems was likely due to the nitrogen source: the CB system was the only one that applied urea for banana cultivation. The use of chemical fertilizers, particularly urea and other nitrogenous compounds, constitutes the main source of GHG emissions in coffee crops (Ratchawat et al., 2020; Cornelius et al., 2025).
In this study, the categories of global warming (GWP), freshwater eutrophication (FEP), and terrestrial acidification (TAP) were analyzed due to their relevance to agriculture.
Figure 1 shows the results for the GWP, FEP and TAP impact categories and their contributions to environmental impacts (direct soil emissions, production of chemical inputs and fertilizers and crop establishment and development) in the study systems.
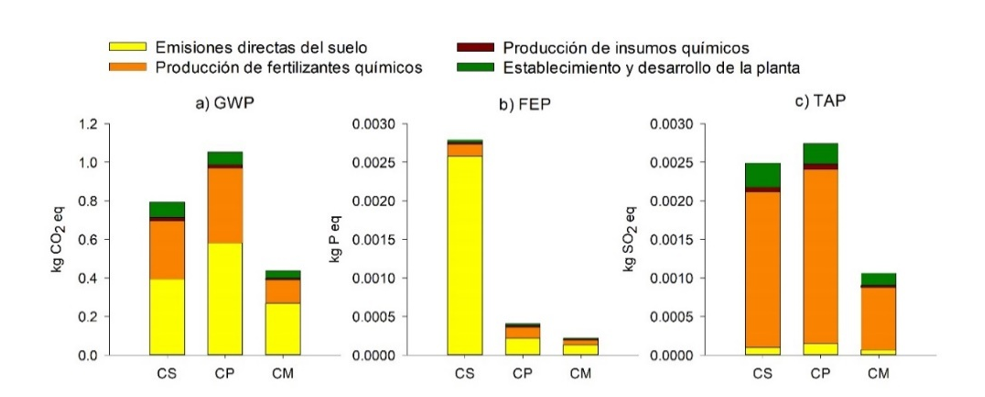
The emission of GHGs into the atmosphere is the main cause of global warming (Guineé, 2002). The results showed that producing 1 kg of cherry coffee results in global warming between 0.44 and 1.05 kg CO2 eq kg-1 in the analysis systems (Figure 1a). These values are consistent with reports on coffee crops (Noponen et al., 2012; Ratchawat et al., 2020; Basavalingaiah et al., 2022).
Direct soil emissions from chemical fertilizer applications were the primary cause of this category, contributing 50, 55 and 61% in the CS, CB and CM systems, respectively (Figure 1a), followed by fertilizer production, which contributed between 28 and 38% (Figure 1a). Similarly, Noponen et al. (2012); Van der Feen et al. (2025) reported that direct and indirect soil emissions, mainly associated with fertilizer use, accounted for 67 and 52%, respectively, in the global warming category.
Eutrophication includes the impacts of excessive levels of macronutrients in the environment, primarily nitrogen (N) and phosphorus (Guinée, 2002). FEP values ranged from 0.00022 to 0.0028 kg P eq kg-1 (Figure 1b). Values that contrast with those of this study were observed in coffee production systems (Basavalingaiah et al., 2022; Rahmah et al., 2022).
Direct soil emissions from chemical fertilizer applications were the main cause in this category, contributing 92, 54 and 60% in the CS, CB and CM systems, respectively (Figure 1b). This is consistent with reports on coffee crops (Pazmiño et al., 2024; Van der Feen et al., 2025).
The research by Hasan et al. (2024) reported that chemical fertilizers applied in agricultural fields can leach into reservoirs and lakes, where nitrogenous nutrients cause eutrophication.
Terrestrial acidification refers to the impact caused by the deposition of acidifying compounds, mainly N and sulfur (Guineé, 2002). TAP values ranged from 0.0011 to 0.0027 kg SO2 eq (Figure 1c). This range is consistent with that reported by Rahmah et al. (2022).
The production of chemical fertilizers significantly influenced this category, contributing 81, 82 and 76% in the CS, CB and CM systems, respectively. The deposition of N in terrestrial ecosystems causes effects such as loss of essential cations in the soil, nutritional imbalances in plants, and acidification (Clark et al., 2013).
Sensitivity analysis (Figure 2) showed that a 25% reduction in dose reduced the impact by 9 to 19% in the three systems in the GWP category (Figure 2a, 2b and 2c), whereas an increase in dose raised emissions by similar amounts.
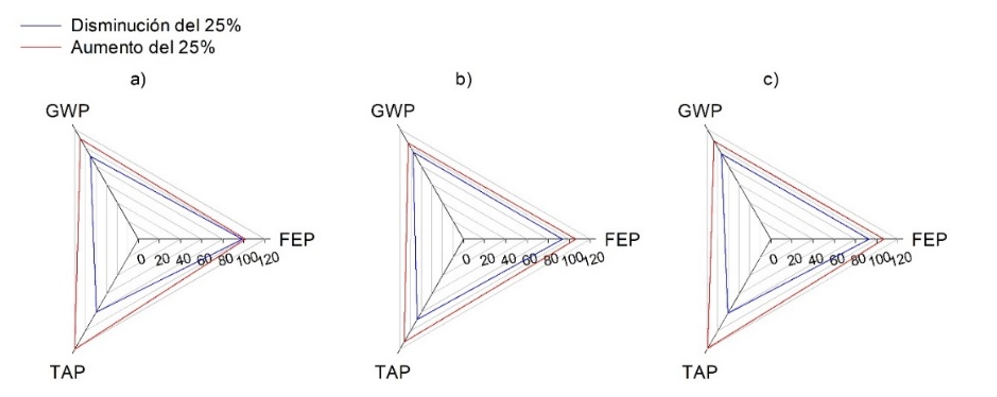
The TAP category showed a 13-21% reduction when fertilization decreased, with equivalent increases when the dose increased (Figures 2a, 2b and 2c). Similarly, Hasler et al. (2015) observed that the N dose significantly affects LCA results.
The life cycle assessment showed clear differences in the environmental performance of the coffee production systems evaluated. The coffee-mango (CM) system had the lowest environmental impacts across all categories. This better performance is associated with higher yields and greater efficiency in the use of inputs.
In all three systems, nitrogen fertilization was the primary critical point in the categories of global warming and eutrophication. Likewise, the sensitivity analysis showed that a 25% reduction in the fertilization dose can decrease environmental impacts.
Overall, the results show that the environmental performance of coffee systems depends not only on the type of production system but also on the efficiency in input management; therefore, optimizing fertilization and adopting diversified agroforestry systems represent key strategies for reducing environmental impacts without compromising productivity.
The authors thank producer Filemón Romero Gutiérrez for allowing this research to be conducted on his coffee production plots.
Basavalingaiah, K.; Paramesh, V.; Parajuli, R.; Girisha, H. C.; Shivaprasad, M.; Vidyashree, G. V.; Thoma, G.; Hanumanthappa, M.; Yogesh, G. S.; Misra, S. D.; Bhat, S.; Irfan, M. M. and Rajanna, G. A, 2022. Energy flow and life cycle impact assessment of coffee-pepper production systems: An evaluation of conventional, integrated and organic farms in India. Environmental Impact Assessment Review. 92:06687. https://doi.org/10.1016/j.eiar.2021.106687.
Clark, C.; Bai, Y.; Bowman, W.; Cowles, J.; Fenn, M.; Gilliam, F.; Phoenix, G. K.; Siddique, I.; Stevens, C. J.; Sverdrup, H. U. and Throop, H. L. 2013. Nitrogen deposition and terrestrial biodiversity. In Encyclopedia of Biodiversity. Levin, SA. Second Edition. Academic Press. 519-536 pp. https://doi.org/10.1016/B978-0-12-384719-5.00366-X.
Huijbregts, M. A. J.; Steinmann, Z. J. N.; Elshout, P. M. F.; Stam, G.; Verones, F.; Vieira, M.; Zijp, M.; Hollander, A. and van Zelm, R. 2017. ReCiPe2016: a harmonised life cycle impact assessment method at midpoint and endpoint level. The International Journal of Life Cycle Assessment. 22(2):138-147. https://doi.org/10.1007/s11367-016-1246-y.
Noponen, M. R. A.; Edwards-Jones, G.; Haggar, J. P.; Soto, G.; Attarzadeh, N. and Healey, J. R. 2012. Greenhouse gas emissions in coffee grown with differing input levels under conventional and organic management. Agriculture, Ecosystems and Environment. 151:6-15. https://doi.org/10.1016/j.agee.2012.01.019.
Rahmah, D. M.; Putra, A. S.; Ishizaki, R.; Noguchi, R. and Ahamed, T. 2022. A life cycle assessment of organic and chemical fertilizers for coffee production to evaluate sustainability toward the energy-environment-economic nexus in Indonesia. Sustainability. 14(7):3912. https://doi.org/10.3390/su14073912.
Romero-Fernández, A. de J.; González-Chávez, Ma. del C. Á.; Herrera-Cabrera, B. E.; Corona-Sánchez, J. E. and Carrillo-González, R. 2023. The coffee-mango association promotes favorable soil conditions for better-nourished and higher-yielding plants. Agriculture, Ecosystems and Environment. 354:108589. https://doi.org/10.1016/j.agee.2023.108589.
Valdés-Velarde, E.; Vázquez-Domínguez, L. P.; Tinoco-Rueda, J. Á.; Sánchez-Hernández, R.; Salcedo-Pérez, E. y Lagunes-Fortiz, E. 2022. Servicio ecosistémico de carbono almacenado en cafetales bajo sombra en sistema agroforestal. Revista Mexicana de Ciencias Agrícolas. 28(esp):287-297. https://doi.org/10.29312/remexca.v13i28.3283.