elocation-id: elocation-id: e4206
The sugar agribusiness requires tools that enable comparison of mill performance and focus actions to reduce in-plant sucrose losses. This study aimed to construct a typology of Mexican sugar mills based on indicators of sucrose losses and factory performance. The research was conducted in Mexico by analyzing secondary information from 46 mills observed in 10 harvests (2012/13-2021 and 2022), which was processed and synthesized in 2025. The base was collapsed at the mill level using the median by variable and standardized with Z-scores. Principal component analysis was applied to integrate four dimensions: sucrose losses, quality and technological potential of cane and juice, sucrose extraction from juice and industrial yield, and operational-energy intensity in the plant. The dimensional scores were used to perform hierarchical clustering (Ward’s method and Euclidean distance), which allowed the identification of six types of mills. Types IV and V concentrated the best overall performance by combining high quality/potential and higher extraction-yield with lower operational-energy intensity; Bellavista and Atencingo stand out. Types I and II showed lags associated with low quality/potential and lower extraction-yield; type VI presented high losses and operational-energy intensity despite relatively high potential, and type III corresponded to the El Carmen mill as an atypical case with high sucrose losses. The main conclusion is that the typology enabled us to guide differentiated strategies for improving and monitoring the plant performance of sugar mills in the Mexican sugar agribusiness.
hierarchical clustering, principal component analysis, specific energy consumption, sucrose recovery.
The sugarcane agribusiness is a strategic activity in Mexico due to its economic impact and the employment it sustains in the regions where it is carried out. In territorial terms, the sugarcane agribusiness is economically relevant in 16 states, which demonstrates its role as an axis of productive and regional articulation (Sandoval-Romero et al., 2025).
In Mexico, during the 2024-2025 harvest, 736 486 ha were industrialized, 45.75 million tonnes of raw cane were milled, and a physical sugar production of 4.77 million tonnes was obtained, with a national average standard base recoverable sugar indicator (KSBRS) of 112.7 kg t-1 of net cane, which synthesizes the sugar potential of cane and its industrial use (UNC-CNPR, 2025).
Despite this scale, the sector’s performance largely depends on the mills’ capacity to convert the cane’s sugar potential into recovered sugar, which is strongly conditioned by sucrose losses occurring before and during the industrial process (Solomon, 2009; Broadfoot, 2020).
In the pre-milling phase, recent literature documents that cut-to-crush delays and postharvest deterioration cause sucrose losses and reductions in industrial recovery, affecting both yield and process quality (Solomon, 2009).
In the plant, a critical loss route is associated with the exhaustion in molasses, and residual sucrose has also been found to constitute the greatest loss in the sugar manufacturing process, so its monitoring and control are decisive for the overall efficiency of the mill (Broadfoot, 2020).
In Mexico, there is also evidence of significant heterogeneity across mills in technical efficiency, productivity and operational performance, suggesting that not all mills convert cane potential into final products with the same effectiveness (Santiago-Zarate et al., 2021; Valdivia-Alcala et al., 2022).
This heterogeneity can be amplified by external conditions: for example, climatic and economic variables have been shown to influence sucrose yield in cane at the mill level, thereby affecting the very basis of industrial utilization (Everingham et al., 2002; Sandoval-Romero et al., 2025).
In this study, plant efficiency is understood in an operational-industrial sense, not as an estimate of technical, allocative, energy, partial or global efficiency using frontier models, but as the capacity of the mill to maximize sucrose recovery and minimize its total losses and by routes (bagasse, molasses, cachaça, and indeterminate) in interaction with the performance of extraction and recovery and the operational stability of the process (Solomon, 2009; Broadfoot, 2020).
The study aimed to construct a typology of sugar mills to characterize plant efficiency associated with sucrose losses, integrating indicators of total losses and by extraction-recovery and operation-energy routes to identify those mills with a critical profile.
The research was observational and non-experimental and used secondary information from sugar mills. The original base corresponds to a retrospective longitudinal panel of 46 mills across 10 harvests (2012-2013 and 2021-2022). For the typology analysis, the information was aggregated by mill using the median of 10 harvests, yielding a cross-sectional sample (n= 46) that was subjected to principal component analysis and hierarchical clustering.
The main sources of information were UNC-CNPR (2025); CNIAA (2024). Statistical runs were performed with Python 3 within a Jupyter Notebook environment, using pandas/NumPy for data cleansing and aggregation and SciPy/scikit-learn/matplotlib for multivariate analysis, hierarchical clustering and figure generation (McKinney, 2010).
As mentioned, the method used was the principal components approach; this multidimensional method allows us to reduce a set of correlated indicators to a smaller number of orthogonal axes that concentrate the greatest variation in the information, facilitating multivariate interpretation and avoiding redundancies.
In agriculture, principal component analysis has been repeatedly used to summarize technical information (constructing minimal variable sets and composite indices) and to support the classification of productive or technological units when there are multiple performance indicators, enabling hierarchical clustering and dendrograms to identify groups with contrasting profiles based on scores or retained components (Núñez-Peñaloza et al., 2023; Álvarez et al., 2024).
As in Kaur et al. (2021), this study carried out an exploratory analysis before clustering, using factorial scores to form stable and comparable clusters, thereby enabling their representation in a hierarchical dendrogram for reading and identifying the respective profiles of the study units.
In this preliminary analysis, a subset of indicators aligned with the study objective was also selected, integrating variables of sucrose (total and by routes), sugar quality and potential, extraction and recovery and operational and energy losses. All quantitative variables were standardized using Z-scores (mean zero and standard deviation of one) to avoid bias from differences in scale across mills and units of measurement.
Principal component analysis was conducted using conceptual blocks on the correlation matrix, and its adequacy was evaluated using the Kaiser-Meyer-Olkin (KMO) statistic, Bartlett’s test of sphericity, and the explained variance of the first component. The values were: D1, KMO= 0.225, Bartlett p< 0.001 and PC1= 51.576%; D2, KMO= 0.762, Bartlett p< 0.001 and PC1= 88.438%; D3, KMO= 0.654, Bartlett p< 0.001 and PC1= 63.665%; and D4, KMO= 0.467, Bartlett p= 0.055 and PC1= 37.677%.
Based on these results and the technological interpretation of each block, the first component was retained as a synthesis indicator. The classification and definition of the number of groups were based on the dendrogram structure and an internal separation criterion (Silhouette).
The exhaustive mathematical representation of the principal component method applied to agriculture is presented in Júdez (1989) and in more formal terms, in Rencher and Christensen (2012); Jolliffe and Cadima (2016). In preliminary runs carried out in Python, it was identified that the performance of factory efficiency can be synthesized in four latent dimensions.
The first dimension (D1) is associated with juice extraction and quality, and its interpretation is that the respective study unit will perform better if juice extraction and quality are higher. The second dimension (D2) corresponds to sucrose losses (loss control); the worst performance of a mill can occur when losses in bagasse, molasses, and cachaça increase.
Dimension three (D3) is associated with specific energy efficiency (steam-electricity-fossils) and is interpreted as indicating that a mill performs better when the specific consumption of steam, electricity, and fossil fuels decreases. Dimension four (D4) is defined as operational stability and capacity utilization, and its interpretation is that there is better performance when downtime decreases and the effective milling rate increases.
Table 1 provides the definitions of the variables synthesized within the respective dimension or principal component.
As mentioned above, in the present study, two analytical stages were distinguished that should not be confused. In the first stage, the industrial variables were grouped into four conceptual dimensions (D1-D4), and within each dimension, a principal component analysis (PCA) was applied to obtain a synthesis indicator (the first component, PC1), which summarizes the information of the variables of that dimension.
In this step, groups are not formed because only the dimensionality is reduced by generating four scores (D1-PC1, D2-PC1, D3-PC1, D4-PC1) that represent each mill’s profile.
In the second stage, these four scores were used as inputs for a hierarchical clustering analysis using Ward’s method, with which the dendrogram was constructed and the number of groups was defined by cutting the hierarchical tree, yielding the final typology of mills. Internal validation of the clustering was carried out by comparing solutions from k= 2 to k= 6 using three indices: Silhouette, Calinski-Harabasz and Davies-Bouldin.
For the six-group solution, Silhouette= 0.2762, Calinski-Harabasz= 22.2514 and Davies-Bouldin= 0.8697 were obtained; this solution presented the highest Calinski-Harabasz value and the lowest Davies-Bouldin value within the evaluated range; although the highest Silhouette value corresponded to k= 2, k=6 was retained because it offered greater typological resolution, coherence with the dendrogram and a technological interpretation of the mill profiles.
Differences among types were contrasted using the Kruskal-Wallis test on dimensional scores, given the unequal group sizes. Significant differences were observed in D1 (H= 19.015; p= 0.0019), D2 (H= 36.502; p< 0.001), D3 (H= 23.102; p< 0.001) and D4 (H=18.656; p= 0.0022), which supports that the identified types have statistically differentiable profiles.
In this way, six types of mills were identified, each representing a distinctive technological profile associated with the combination of sucrose losses, quality/potential, extraction-yield, and operation-energy. This allows us to compare and characterize industrial performance across groups. These six groups can be observed in the dendrogram, as shown in Figure 1.
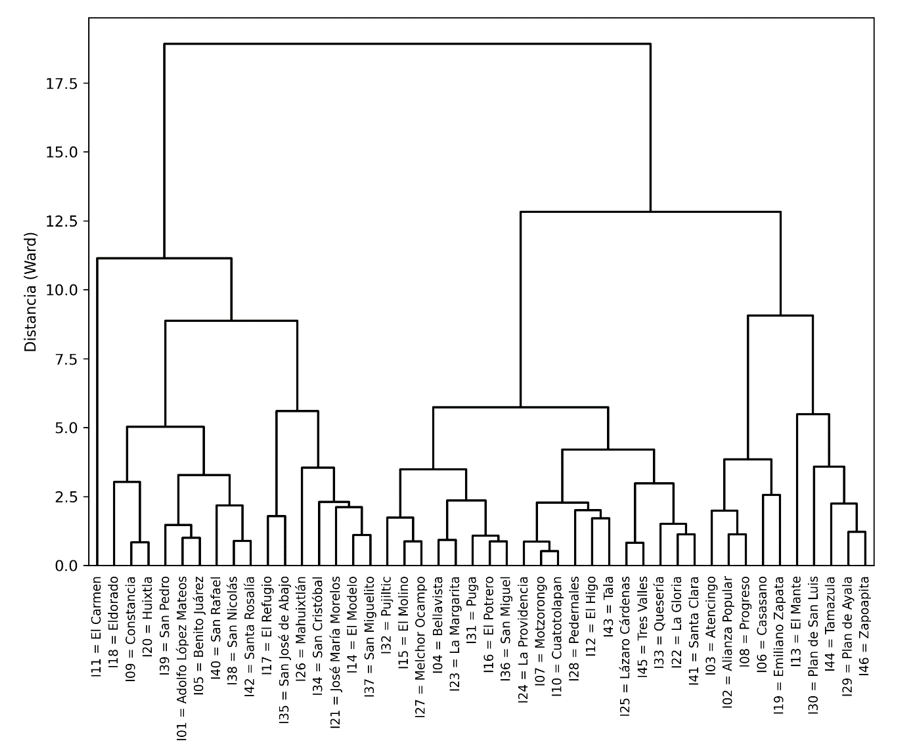
This type of mill is characterized by sucrose losses (D1) close to medium-high values, low quality and low technological potential of the cane and juice (D2), lower sucrose extraction from juice and industrial yield (D3), and operational and energy intensity in the plant (D4) close to average. Seven mills are included in this group, among which El Modelo (I14) and El Refugio (I17) stand out.
In this study, the expression ‘close to average’ indicates that the dimension score is near the central value of the set of mills (standardized scores), without being markedly higher or lower.
This type of mill is characterized by relatively low sucrose losses (D1), low quality and low technological potential of the cane and juice (D2), levels of sucrose extraction from juice and industrial yield (D3) close to the typical value of the set, and relatively high operational and energy intensity in the plant (D4). Nine mills are included in this group, among which Benito Juárez (I05) and Huixtla (I20) stand out.
This type of mill is characterized by very high sucrose losses (D1), very low quality and very low technological potential of the cane and juice (D2), lower sucrose extraction from juice and markedly low industrial yield (D3), and very high operational and energy intensity in the plant (D4).
This group contains only one mill, El Carmen (I11), which indicates atypical behavior compared with the other mills analyzed. This profile reflects unfavorable operating conditions within the estimated typology, so it should be interpreted as a group with greater relative technical-industrial constraints, not as a prediction of closure or market exit.
This type of mill is characterized by relatively low sucrose losses (D1), high quality and high technological potential of the cane and juice (D2), greater sucrose extraction from juice and industrial yield (D3), and relatively low operational and energy intensity in the plant (D4). Nineteen mills are in this group, among which Bellavista (I04) and Motzorongo (I07) stand out.
This type of mill is characterized by sucrose losses (D1) close to the set’s typical value, very high quality and very high technological potential of the cane and juice (D2), greater extraction of sucrose from the juice and industrial yield (D3), and relatively low operational and energy intensity in the plant (D4). This group has five mills, among which Alianza Popular (I02) and Atencingo (I03) stand out.
This type of mill is characterized by very high sucrose losses (D1), high quality and high technological potential of the cane and juice (D2), levels of sucrose extraction from the juice and industrial yield (D3) close to the set’s typical value and very high operational and energy intensity in the plant (D4). Five mills are in this group, among which El Mante (I13) and Plan de Ayala (I29) stand out.
In this way, it can be stated that as a whole, the typology shows a clear performance gradient: type IV and type V mills concentrate the best overall performance, combining high quality and technological potential (D2) with greater sucrose extraction from juice and industrial yield (D3) and relatively low operational and energy intensity (D4); in contrast, types I and II reflect less favorable conditions due to their low quality/potential (D2) and lower extraction-yield (D3); for their part, type III represents an outlier with extreme values in several dimensions; and type VI suggests a pattern of high losses (D1) and high operating intensity (D4) despite maintaining a relatively high potential (D2).
The typology obtained from the dimensional scores (D1-D4) and their subsequent hierarchical clustering allows factory performance to be interpreted as technological combinations rather than as isolated indicators, which is especially useful for advising and decision-making in mills because it reduces the ambiguity typical of dashboards with dozens of variables (Adolfsson et al., 2019; LaFevor, 2022).
In methodological terms, using a hierarchical method that minimizes intra-group variance makes it easier to recognize technological ‘leaps’ between sets of mills, and using an internal criterion of separation, such as silhouette, provides quantitative evidence that the groups are not arbitrary but relatively cohesive and separable.
This logic aligns with the classical fundamentals of Ward’s hierarchical clustering and silhouette validation, both widely used to justify cluster solutions in multivariate applications (LaFevor, 2022).
From a technological point of view, the sucrose loss dimension (D1) and the cane-juice quality/potential dimension (D2) usually reflect processes that begin before the factory and are amplified within it.
International evidence shows that harvest-to-crush/cut-to-crush delays accelerate sucrose degradation and deteriorate juice quality, affecting both recoverable yield and industrial process stability (Sibomana et al., 2016).
In this logic, the groups with low quality/potential and higher losses can be interpreted as cases where the problem is not only ‘plant operation’ but also a combination of logistics/supply (times), raw material management and loss control by route.
This justifies that, rather than a single recipe, the discussion proposes strategies differentiated by type: in some mills, the priority will be to ‘recover potential’ (improve quality/times/condition of cane and juices), whereas in others, it will be to ‘close losses’ at specific points of the process (bagasse, cachaça, molasses and undetermined).
In relation to the dimension of sucrose extraction from juice and industrial yield (D3), recent literature emphasizes that extraction efficiency is not only a matter of ‘installed capacity’ but also of cane preparation, mechanical condition, and operating parameters that determine the release of juice and the recovery of sucrose at a reasonable energy cost.
In particular, it has been documented that the level of preparation/fragmentation of the cane (preparation index) is associated with measurable changes in the material’s mechanical properties and with increases in extraction efficiency, which makes this point a clear technical lever for mills where D3 appears to lag behind (Wibowo et al., 2025).
Therefore, when a type has high quality/potential (D2) but moderate or low extraction/yield (D3), the most useful interpretation for the applied reader is an internal ‘conversion gap’: the mill has what it takes, but it does not convert it effectively; that is where audits of cane preparation, imbibition control, grinding conditions and extraction control make sense.
Regarding the dimension of operational-energy intensity (D4), its practical reading is that it is not enough to ‘produce’; what matters is how it is produced: with downtime, instability, a high specific consumption of steam/electricity/fuels or with stable and efficient operation.
In sugar factories, energy-exergy analyses have been shown to identify thermodynamic losses and optimization opportunities, primarily related to steam use, thermal integration, and equipment performance (including cogeneration), which helps explain why some mills can have acceptable performance in extraction yet be penalized by high energy intensity (Taner and Sivrioglu, 2015).
In addition, international comparisons of energy performance in the sugarcane industry show relevant gaps between ‘traditional’ and ‘modern’ mills, reinforcing the idea that clusters can be interpreted as technological echelons (not just ‘statistical groups’) (Birru et al., 2019).
Finally, a central contribution of the study is that the typology integrates into a single scheme quality/potential, losses, extraction/yield and operational-energy intensity, which makes it possible to prioritize actions with ‘dominant bottleneck’ logic: i) if the lag is in D2/D1, the focus is on raw materials, times, and loss control; ii) if the lag is in D3, the focus is on industrial preparation and recovery; iii) if the lag is in D4, the focus is on operational stability and energy integration; and iv) if a mill behaves as atypical, the reasonable recommendation is a specific diagnosis before comparing it against sectoral averages.
This form of reading is consistent with the applied objective of the dendrogram: not to ‘label for the sake of labeling’ but to guide replicable improvement paths by type, based on observable technological patterns.
In the study, it has been found that it is possible to classify the mills into an operational typology of six types, built from the combination of sucrose losses, quality and technological potential of the cane and juice, sucrose extraction from juice and industrial yield, as well as operational-energy intensity at the plant.
Overall, the typology revealed a clear performance gradient, in which types IV and V concentrated the most favorable behavior by associating high quality/potential (D2) with greater extraction and industrial yield (D3) and a relatively low operational-energy intensity (D4); these types of better performance include representative mills such as Bellavista (I04) and Atencingo (I03).
In contrast, types I and II were characterized by less favorable conditions, mainly linked to low quality/potential (D2) and lower extraction and industrial yield (D3), which suggests prioritizing strategies aimed at improving the technological base related to entry quality and industrial recovery.
Type VI stood out for exhibiting high sucrose losses (D1) and high operational-energy intensity (D4) despite maintaining a relatively high potential (D2), which points to an internal conversion gap at the plant and opportunities for improvement in loss control and operational stability.
Finally, type III, corresponding to the El Carmen mill, was identified as an atypical case (a single mill) with extreme values in several dimensions, which supports the convenience of a specific diagnosis. In applied terms, this typology constitutes a diagnostic input to order the technical-industrial comparison between mills and identify potential areas for improvement; however, the definition of specific strategies requires additional information on management, costs, investment and regional conditions.
Alvarez, S.; Timler, C. J.; Michalscheck, M.; Paas, W.; Descheemaeker, K.; Tittonell, P.; Andersson, J. A. and Groot, J. C. J. 2018. Capturing farm diversity with hypothesis-based typologies: an innovative methodological framework for farming system typology development. PLoS One. 13(5):e0194757. https://doi.org/10.1371/journal.pone.0194757.
Everingham, Y. L.; Muchow, R. C.; Stone, R. C.; Inman-Bamber, N. G.; Singels, A. and Bezuidenhout, C. N. 2002. Enhanced risk management and decision-making capability across the sugarcane industry value chain based on seasonal climate forecasts. Agricultural Systems. 74(3):459-477. https://doi.org/10.1016/S0308-521X(02)00050-1.
Santiago-Zárate, I. M.; Martínez-Damián, M. Á.; Cuevas-Alvarado, C. M.; Valdivia-Alcalá, R.; García-Hernández, M. I. y Hernández-Toscano, J. 2021. Productividad y cambio tecnológico en la agroindustria de la caña de azúcar en México. Revista Mexicana de Ciencias Agrícolas. 12(6):1005-1017. Doi: https://doi.org/10.29312/remexca.v12i6.2692.
Sibomana, M. S.; Sobratee, N.; Workneh, T. S. and Bezuidenhout, C. 2016. Post-harvest changes in sugarcane during harvest-to-crush delays in the KwaZulu-Natal Midlands. International Sugar Journal. 118(1410):442-449. https://www.researchgate.net/publication/305006068-Post-harvest-changes-in-sugarcane-during-harvest-to-crush-delays-in-the-Kwazulu-Natal-Midlands.
Valdivia-Alcalá, R.; Cuevas-Alvarado, C. M.; Vázquez-Muñoz, J. S.; García-Hernández, M. I.; Santiago-Zárate, I. M. y Garay-Jácome, Á. S. 2022. Análisis de la eficiencia y retornos de escala de los ingenios azucareros de México. Revista Mexicana de Ciencias Agrícolas. 13(1):141-153. Doi: https://doi.org/10.29312/remexca.v13i1.2639.
Wibowo, A.; Nugroho, G. and Muflikhun, M. A. 2025. Complex evaluation process on the sugarcane juice harvesting by using preparation index related to the mechanical properties: a key foundation for modeling and improved milling efficiency. Food and Bioproducts Processing. 153(5)22-32. Doi: https://doi.org/10.1016/j.fbp.2025.05.011.