elocation-id: elocation-id: e4189
The environmental and economic aspects of white corn production in Guanajuato between 2016 and 2020 were studied. The factors that significantly contribute to the environmental impact of irrigated (MR) and rainfed (MT-450) corn production, as well as the profitability of production and its contribution to local self-sufficiency of this grain, were determined. The environmental impact was evaluated using the life cycle assessment methodology, with one tonne of grain as the functional unit; emissions were estimated using Ecoinvent v 3.9, and the environmental impact indicators were estimated using ReCiPe 2016 v 1.1. The economic analysis was performed with an optimization model that seeks the maximum gross income with constraints on food self-sufficiency, soil, and water. Irrigated and rainfed corn have loads of 871 and 244 kg CO2eq t-1 respectively, for the climate change indicator. In irrigated corn, the environmental impact is primarily associated with high electricity consumption for water extraction and distribution. In rainfed corn, the environmental impact is associated with the disproportion between production and inputs. In the economic analysis, it was estimated that local corn production meets 83% of the total demand for the grain. The benefit/cost ratio for rainfed and irrigated corn was estimated at 1.48 and 0.8, respectively. Agricultural profitability is conditioned by prices and the market: with a 3% change in the irrigated area of cereals, a 50% increase in the demand for vegetables can be met.
Life Cycle Assessment (LCA), irrigation and seasonality, sustainability.
Corn is one of the most important food cereals globally and a fundamental component of diets in regions such as Africa and the Americas (Erenstein et al., 2022; FAO, 2023). In Mexico, white corn is the main ingredient in the diet and tortillas are its main by-product (Espejel-García et al., 2016).
National white corn production is mainly for human consumption, whereas a large amount of yellow corn is imported from the United States of America for livestock use. In 2023, 17 615 000 t were imported, corresponding to 40% of national demand (FAO, 2023). Rainfed corn production went from 77% to 52% of national production between 1980 and 2022, giving more space to the irrigated crop (SIAP, 2023).
To holistically analyze the sustainability of food production, agriculture must be studied as a system highly interrelated with social, economic and environmental factors.
The term agricultural systems analysis (ASA) has been used to analyze the different factors that condition the economic, social, and environmental performance of farm management or in regional and national settings (Macfadyen, 2019). Phenomena such as globalization affect agricultural systems in different ways and intensities (Lambin and Meyfroidt, 2011).
Countries with weak and vulnerable agricultural systems are affected by globalization through food dependence associated with international trade (Lähde et al., 2023), highlighting the need to assess sustainability in national and international contexts. Agricultural systems can be represented by models in which the factors of production and consumption integrate linked nodes of transfer functions (Walters et al., 2016).
Life cycle assessment (LCA) is a methodology that attributes environmental effects to the consumption of natural resources and energy, emissions, and waste generated during the production, distribution, and consumption processes (Ríos-Fuentes et al., 2022).
This methodology has been widely used in the environmental analysis of corn production. In regional studies for the United States of America, China and Europe, the climate change indicator values are 271, 640 and 185 kg of CO2eq t-1, respectively (Qi et al., 2018; Holka et al., 2020; Koushki et al., 2023).
The environmental impact is directly related to local agroclimatic factors. The United States of America produces large quantities of corn at low production costs and with low environmental impacts, which are associated with climatic conditions, soil quality, technological factors, and government support (Foley et al., 2020).
Mexico aims to achieve food self-sufficiency in corn by 2024-2030 (SADER, 2025). A fundamental step in achieving this goal is analyzing the sustainability of corn production as an integral part of the national agricultural system. Corn production in Guanajuato is considered to exhibit a productivity gap, associated with inefficient productivity/input ratios that lead to high environmental impacts and production costs.
This study aimed to identify the agricultural and commercial factors that condition the sustainability of corn production in Guanajuato using the LCA methodology and an optimization model. The results of this study can contribute to understanding the agricultural problem and provide recommendations for improvement.
White corn production in Guanajuato was studied for the 2016-2020 period. The LCA methodology (ISO 14040 and 14044: ISO, 2006) was applied to evaluate two scenarios: ‘irrigated corn (IC)’ and ‘rainfed corn (RC-450, regions with annual rainfall of 450 mm)’.
The functional unit (FU) is 1 t of harvested corn. The foreground inputs (seeds, fertilizers, and herbicides) were obtained from INIFAP-Bajío (INIFAP, 2017). The information on fuels and electricity used for irrigation was obtained from FIRA (2024). Environmental impacts were estimated with SimaPro® v9.5, which uses the ReCiPe 2016 v1.1 methodology (Huijbregts et al., 2017). The background inventories were obtained from the Ecoinvent v3.9 database.
In the economic analysis, a mathematical model of an agricultural system with constraints on food self-sufficiency, soil and water was proposed. The model considers local production, imports and exports, differentiating local and external prices.
Imports are limited by local supply. Two scenarios are considered for exports: the base scenario, which represents the state’s production and consumption in 2023 (SIAP, 2023; FAO, 2023), and the extended scenario, where external demand for agricultural products was considered to increase by 50%.
The objective function of the model is presented in equation 1, which expresses achieving the maximum gross income of the agricultural system (Max Igross), which consists of local (Si, local) and external (Si, ext) sales, production costs (PCi) and import payments (IPi, imp).
The decision variables in the extended case are the areas allocated to each crop. In both scenarios, local demands for agricultural products are met. The optimization model was solved with the Solver routine of Excel®.
Table 1 presents the inventory of inputs and yields for white corn production under the IC and RC-450 scenarios; Table 2 in turn, shows the environmental impact indicators. In the analysis of the background (in input production) and foreground (in corn production) contributions of production factors to environmental impact, the main drivers were found to be electricity consumption for irrigation in the IC scenario and the background environmental load of DAP (diammonium phosphate) in RC-450, which is also associated with low productivity.
The climate change indicator is a benchmark in environmental impact studies due to its relevance and its association with damage to human health and ecosystems. This indicator has been estimated for the most productive corn regions of the United States of America, China and Europe, with values of 271, 640 and 185 kg of CO2 eq t-1, respectively (Qi et al., 2018; Holka et al., 2020; Koushki et al., 2023).
In these regions, the most important driver of environmental impact is chemical fertilization, where DAP stands out, which is produced with a large environmental load generated during its production due to high energy consumption and inadequate management of depleted phosphate rock remains; it is mainly produced in China (Zhang et al., 2017).
In Mexico, the recommended nitrogen dose is 250-300 kg of N for an expected productivity of 13 t ha-1 (Sánchez-de Jesús et al., 2024). Nonetheless, the national average for irrigated corn production is 6.74 t ha-1, whereas Sinaloa, Sonora, Baja California, Guanajuato and Chihuahua have an average of 11.14 t ha-1, indicating a wide productivity gap.
In Guanajuato, the climate change indicator is primarily linked to energy consumption for extracting and distributing well water. The average well depth is 170 m, with a range of 30-400 m. In Mexico, electricity consumption for pumping groundwater is 1-1.3 kWh m-3 (FIRA, 2024).
In this region of Mexico, a total of 11 000 m3 ha-1 is allocated for surface water and road irrigation; for groundwater, a demand of 5 000 m3 ha-1 is considered. In irrigated systems in the United States of America, yields of up to 14 t ha-1 are achieved with 6 000 m3 ha-1 (Koushki et al., 2023). Water consumption and chemical fertilization in this region of Mexico are inefficient due to the low ratio between production and inputs, generating one of the highest corn productivity gaps in the world (GYGA, 2024).
For irrigated corn, electricity use for water extraction is the dominant factor. In rainfed corn, the dominant factor is the environmental loads generated during DAP production (background).
In the case of RC-450, the application of DAP is considered the dominant factor in environmental impact. The high environmental load of DAP is linked to production and heavy-metal leaching processes (Zhang et al., 2017). Although RC-450 showed lower impacts in 12 of the 18 indicators evaluated, it recorded higher values for human toxicity, marine and terrestrial ecotoxicity, metal depletion, and land occupation. The occupation of agricultural land was 2.66 times higher than that of IC due to its lower yields per functional unit.
The results show that rainfed corn production has lower environmental impacts; however, its yields and planted area have decreased by 3 923 ha year-1 since the beginning of the century (SIAP, 2023), mainly due to low profitability and losses. The LCA allowed us to identify the main environmental hotspots in corn production: electricity in IC and the yield-fertilization ratio in RC-450.
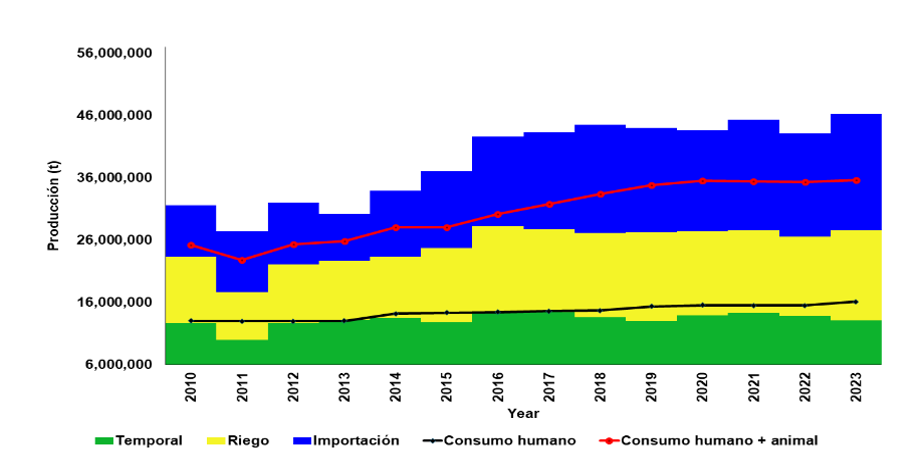
Figure 1 shows the evolution of the national corn supply, comprising irrigated and rainfed production and imports, as well as human and livestock consumption, which represent the total demand. Mexico imports large volumes of yellow corn at international prices lower than national prices, putting pressure on the domestic market (USDA, 2024). Trade integration has increased the Mexican agricultural system’s exposure to international price volatility and external competition, limiting the profitability of staple grains (OECD, 2023).
Table 3 presents the base scenario, corresponding to the agricultural areas planted in 2023. The results show that local vegetable production amply meets state demand, whereas staple grains do not fully meet consumption requirements. In particular, irrigated and rainfed corn cover 61.65 and 23.26% of local demand, respectively. For its part, broccoli production far exceeds domestic demand, confirming its orientation toward foreign markets (SIAP, 2023; FAO, 2023).
The benefit/cost ratio for rainfed and irrigated corn was estimated at 1.48 and 0.8 respectively, indicating that rainfed corn is produced with significant monetary losses for producers. The permanence of the latter system is associated with self-consumption, productive tradition, external support and the limited economic alternatives available to rural producers (Eakin et al., 2014).
In the extended scenario, small reductions in the area allocated to irrigated corn, beans, and other cereals allow the production of broccoli and other export vegetables to increase. The system’s gross income increases from $6 880 million to $11 087 million. The optimal solution identified by the model suggests that economic profitability favors expanding horticultural crops; nevertheless, its implementation would depend on factors not explicitly considered in the analysis, such as the infrastructure and absorption capacity of the markets.
Rainfed corn had lower environmental impacts than irrigated corn in most of the categories evaluated; however, it showed higher values for human toxicity, ecotoxicity, and agricultural land occupation due to its lower yields. The main environmental hotspots identified were electricity consumption for water extraction in irrigated corn and the production of diammonium phosphate (DAP) in rainfed corn.
Irrigated corn contributed more to local supply and was more profitable than rainfed corn. On the other hand, the optimization model indicated that expanding horticultural crops increases the agricultural system’s income, although it can reduce the area allocated to staple grains.
Overall, the results show trade-offs among economic profitability, food security, and environmental impact; therefore, the sustainability of the agricultural system requires improving the efficiency of water, energy and fertilizer use simultaneously without compromising the production of staple foods.
Foley, D. J.; Thenkabail, P. S.; Aneece, I. P.; Teluguntla, P. G. and Oliphant J. 2020. A meta-analysis of global crop water productivity of three leading world crops (wheat, corn and rice) in the irrigated areas over three decades. International Journal of Digital Earth. 13(8): 939-975. https://doi.org/10.1080/17538947.2019.1651912.
Huijbregts, M. A. J.; Steinmann, Z. J. N.; Elshout, P. M. F.; Stam, G.; Verones, F.; Vieira, M. D. M.; Hollander, A.; Zijp, M. and Van Zelm, R. 2017. ReCiPe 2016 v1.1: A harmonized life cycle impact assessment method at midpoint and endpoint level. The International Journal of Life Cycle Assessment. 22(2):138-147. https://doi.org/10.1007/s11367-016-1246-y.
Ríos-Fuentes, B.; Rivas-García, P.; Estrada-Baltazar, A.; Rico-Martínez, R.; Miranda-López, R. y Botello-Álvarez, J. E. 2022. Life cycle assessment of frozen broccoli processing: environmental mitigation scenarios. Netherlands. Sustainable Production and Consumption. 32:27-34. Doi:10.1016/j.spc.2022.04.001.
Sánchez-de Jesús, M. A.; Volke-Haller, V. H.; Cortés-Flores, J. I.; María-Ramírez, A. y San Martín-Hernández, C. 2024. Aporte de nitrógeno por el suelo y eficiencia de aprovechamiento del nitrógeno aplicado en maíz de temporal. México. Revista Fitotecnia Mexicana. 47(2):99-110. https://doi.org/10.35196/rfm.2024.2.99.