elocation-id: elocation-id: e4136
Fresh avocado consumption has increased in recent years, and Mexico has a supply deficit, which forces surplus states to redistribute their volumes to deficit markets. Because it is a perishable good, its distribution must be carried out efficiently, minimizing transportation times. This study develops a comprehensive methodology using the Simplex Method to plan the marketing of fresh avocados within the context of a trade balance for a closed market in 2022. Using information on production, population and fruit exports, modeling seeks to optimize the allocation of surplus product to deficit markets while minimizing logistical transportation costs. The proposed model analyzes routes and recommends the optimal quantities to be sent to each demanding market annually, in order to balance avocado supply and demand, thereby ensuring timely availability at the points of final consumption. The model determined a surplus supply of more than 1 110 000 t; the states of Jalisco, Michoacán, Morelos and Nayarit would supply demanding states, based on the transportation costs that optimize their distribution.
Persea americana Mill., demander, logistics, supplier.
Developing an effective transport model for distributing avocados in Mexico is essential for optimizing logistics costs and strengthening the supply chain for fresh products. Avocado is one of Mexico’s most important agricultural products, with a production of more than 2.5 million tonnes, representing 3.143 billion dollars ( SIAP, 2023 ), thereby consolidating the country as the world’s leading producer and exporter of this fruit ( SAGARPA, 2017 ).
Michoacán leads the national avocado production, with municipalities such as Uruapan, Tancítaro, Peribán, Tacámbaro, Nuevo Parangaricutiro, Salvador Escalante and Ario de Rosales standing out ( Sánchez-Valdés and Sánchez-Rodríguez, 2021 ), followed by Jalisco, Nayarit and Morelos ( FIRA, 2017 ).
Nevertheless, the geographical dispersion of the producing areas and the associated challenges, such as infrastructure, road safety and vehicle regulations, among others, demand the design of firm models that enable the optimization of transport routes and improve traceability to demanding markets.
Given the above, the distribution of fresh avocado must ensure quality and preserve the organoleptic characteristics during transportation along the supply chain, which will ensure the health benefits of consumers, as mentioned by Orjuela-Castro et al . (2017) . According to statistics from the Agricultural and Livestock Information System (SIAP, by its Spanish acronym), in 2022 (the year of study of this research), total avocado production in Mexico was 2 540 715 t, with 41% destined for the international market and the rest distributed internally ( SIACON, 2024 ).
The distribution of avocado in Mexican territory is not equitable; while some regions have easy access to this product (urban area), others face limitations in its availability (rural area), which prevents equal per capita consumption throughout the country ( Rubí-Arriaga et al ., 2019 ). Likewise, logistics costs are directly linked to the performance and profitability of the supply chain, and knowing and managing them is key to improving competitiveness ( Orjuela-Castro et al ., 2016 ).
Transportation is an influential factor in logistics costs ( Ballou, 2004 ), especially for perishable products, since the use of refrigerated transport increases costs, as it prevents their deterioration and losses, thereby preventing their premature maturation or deterioration ( Chica et al ., 2024 ).
The distance between the place of production and consumer markets also affects fuel, vehicle maintenance and toll costs; therefore, the purpose of this transport model is to find destination markets and routes that minimize the cost and distance of avocado transport from economic, operational, and business perspectives.
The transport model is used to plan the distribution of goods and services from various supply points to various destinations ( Ballou, 2004 ). It aims to minimize total costs under supply and demand constraints ( Nanlan and Fanrong, 2025 ), employing a quantitative approach that relies on classical spatial models to justify the relationship between transportation cost and the distance between the producing area and the consumer market (de Carvalho-Santana, 2023).
Therefore, this research aimed to optimize the distribution of avocado ( P. americana Mill.) in Mexico through a linear programming model that balances supply and demand in national consumer markets.
The present study follows a quantitative approach, based on analyzing and processing primary and secondary information, conducting a literature review, and processing web pages to collect official data, which involves techniques that intend to associate the results with numerical information through processing and execution in specialized linear programming software.
The model is based on the Simplex Method that considers a mathematical vision applied to a closed market, developing a standard linear formulation where it defines the objective function that sums the unit costs that are multiplied by the quantities to be shipped, subject to the constraints that equal total supply and demand, as well as to the conditions of non-negativity ( Ayansola-Olufemi et al ., 2015 ).
The information required to develop the model was data on total production and exports of fresh avocado of each state in the corresponding period and the estimated state population; this information was obtained from statistical sources and official databases consulted and referenced for 2022; these include the Agrifood Information Consultation System (SIACON, by its Spanish acronym), National Population Council (CONAPO, by its Spanish acronym), Food and Agriculture Organization of the United Nations (FAOSTAT).
The aforementioned information is used to calculate the net trade balance and available state consumption, which is then multiplied by the calculated per capita consumption in order to obtain the matrix of surplus states (positive results) and the matrix of deficit states (negative results). Next, the formula equating total supply with total demand is solved; therefore, a balanced transport model ( Taha, 2012 ). Subsequently, transportation costs from each supplying state to each demanding state were obtained with the GlobalMap® application.
The mathematical formulation of the objective function assumes that there are m origins and n destinations. Where airepresents the units available to be offered at each origin i= (i= 1, i= 2, ..., m) and bjare the units required at the destination j= (j= 1, j= 2, ..., n). Let Cijbe the unit transport cost on the route linking origin i and destination j.
The objective was to determine the number of units transported from origin i to destination j, in such a way as to minimize the total transportation costs; as an important piece of data and given the optimization in specialized software, a destination can receive its total quantity demanded from one or more origins if this optimizes transportation costs ( Taha, 2012 ).
Let Xijbe the number of units transported from origin i to destination j ( Hillier and Lieberman, 2015 ); then the linear programming model that represents the transport model is as follows ( Nanlan and Fanrong, 2025 ):
With xij ≥ 0 for all i and for all j.
The formulation of the objective function results in 112 terms, which are the product of the four supplying states multiplied by the 28 demanding states, as shown in the following model ( Taha, 2012 ):
Each model has as many supply constraints as there are origins i and as many demand constraints as there are destinations j.
The proposed problem can be adjusted to a mathematical model and run using optimization software such as the Lindo® 6.1 linear programming language to perform matrix operations that minimize costs and yield optimal results ( Braga and Salles, 2022 ) for avocado distribution. The value of the objective function and the optimal quantities to be sent from each origin to each destination, either in full or in part, will be obtained.
For the year of analysis, 2022, the total estimated population in Mexico was 129 365 552 people ( CONAPO, 2024 ), and a total harvested fresh avocado production of 2 540 715 t was calculated ( SIAP, 2022 ); this information resulted in a per capita consumption of 11 586 kg (886 g more than that reported by SIAP, 2023 ) and a total available production of 1 498 000 t, an amount available to be distributed among the 32 states.
The producing states with the capacity to meet the deficient states’ demand have a total supply of 1 110 979.99 t to cover the total demand ( Table 1 ). The resulting net trade balance shows four states as suppliers after self-consumption: Michoacán, Jalisco, Nayarit and Morelos, which will be able to supply the national market of the remaining 28 states.
Then, using the GlobalMap® application, transportation costs from each origin to each destination are calculated, considering an 11-tonne, 3-axle, 8-wheel refrigerated box truck and a national fixed cost of 24.50 pesos per liter of fuel; this allows us to complete the model’s objective function.
The objective function, together with the supply and demand constraints, is run in the Lindo® 6.1 programming language, yielding a value of $15 683 270 000.00 Mexican pesos, which represents the estimated annual cost of transporting the avocado in an optimal way from the surplus states to each of the demanding markets along the identified routes, given the distances between each of them.
In the optimized results ( Table 2 ), it is identified that there are states that do not receive allocations, indicating that no quantity has been allocated for distribution from the supplying state; this suggests that sending the product to those markets does not minimize the cost of transportation in the context of the supplying states considered; however, other supplying states can supply such markets. Ultimately, one or more of the supplying states will have to cover the state consumption deficit, ensuring a balance between supply and demand for fresh avocados for all of Mexico.
In this optimal distribution, Michoacán ranks as the largest distributor, sending 968 472 t to 23 states (in two states, it shares supply with other states). It is followed by Jalisco, which markets 104 944 t, supplying seven states (it shares supply with two states). Nayarit distributes a surplus of 29 020 t, meeting only 84% of Sonora’s demand. Finally, Morelos, with its surplus, satisfies 43% of Guerrero’s demand.
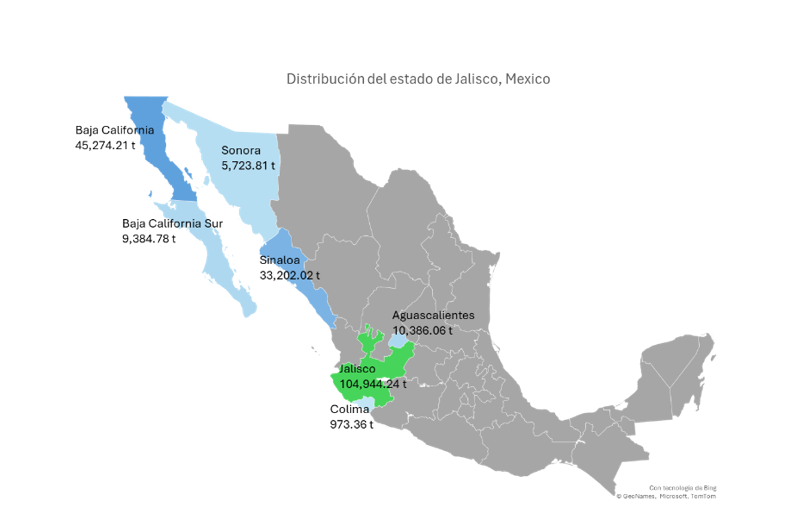
Figure 1 shows that the available production of the state of Jalisco (supplier in green) is distributed as follows: 43.14% to Baja California, 31.64% to Sinaloa and the remaining 25.22% to Aguascalientes, Baja California Sur, Sonora and Colima, thereby optimizing the cost of transportation to reach those avocado-demanding markets. The colorimetry in the figures indicates that the stronger the shade of blue, the greater the amount that needs to be supplied in each state.
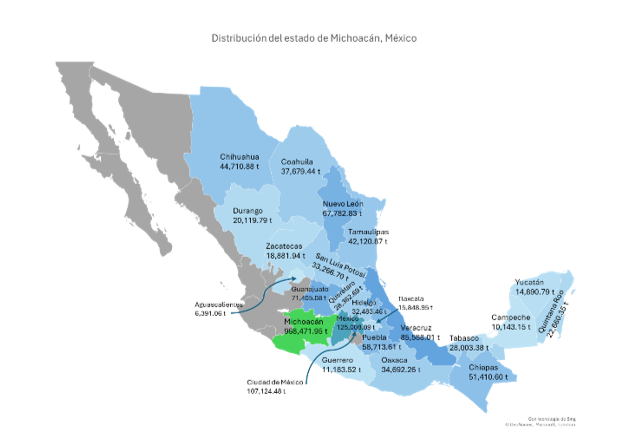
Regarding Michoacán ( Figure 2 ), with surplus production of more than 968 000 t, it allocates its optimal distribution to 23 states with greater demand, as follows: State of Mexico (125 008 t), Mexico City (107 124 t), Veracruz (85 588 t), Guanajuato (71 405 t), Nuevo León (67 783 t) and Puebla (58 714 t); together these states add up to 53% of Michoacán’s available supply.
In the case of the state of Guerrero, it requires almost 20 000 t of fresh avocados; of these, 56.69% are supplied by Michoacán, and the rest of its market demand is met by the state of Morelos. For the state of Aguascalientes, Michoacán supplies the shared complement of 6 391 t (38.09%) ( Table 2 ).
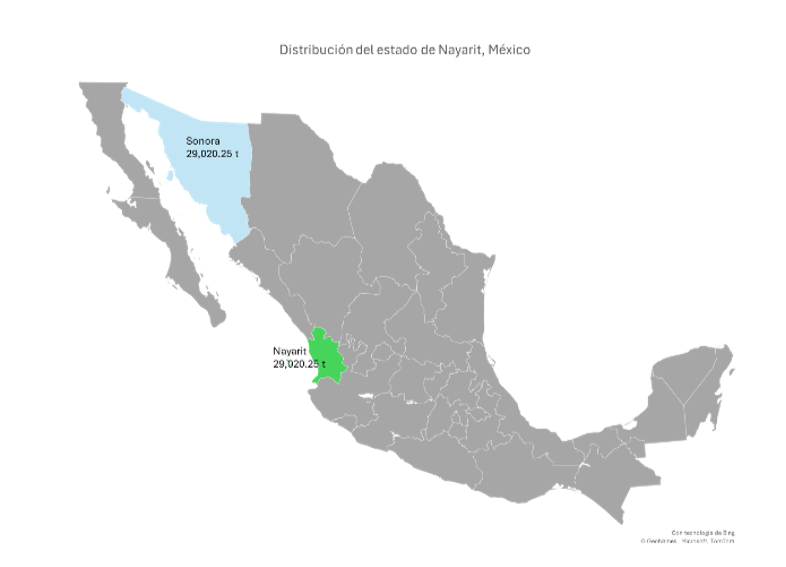
Nayarit, the third largest supplying state, has more than 29 000 t ( Figure 3 ); this surplus production is sent only to the state of Sonora, which complements the amount sent by the state of Jalisco ( Table 2 ); given the proximity between these two states, the cost of transportation to this demanding state is optimized.
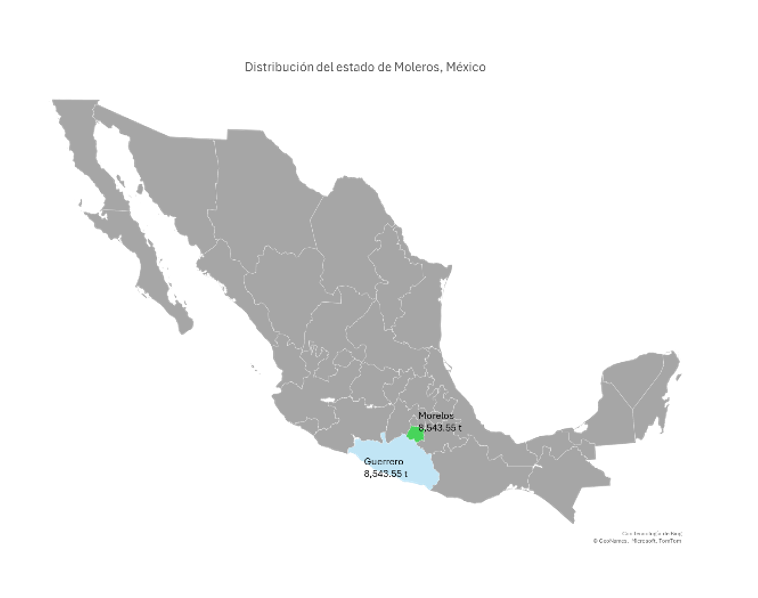
Finally, Morelos, after meeting its demand, has more than 8 500 t to supply to other markets; nevertheless, the optimal result of the model indicates that, given the transport costs involved, it is convenient to send 100% of its fruit availability to the state of Guerrero due to the proximity ( Figure 4 ).
The largest avocado producer in Mexico is the state of Michoacán ( Figure 2 ), proposing its distribution to most of the deficit states, including states with large populations, such as Mexico City, Guanajuato, Nuevo León, State of Mexico, Puebla and Veracruz, which together account for 41.63% of the total number of people in Mexico, which sustains a more frequent demand for this fruit. Per capita consumption, on the other hand, has increased in recent years from 7.6 kg in 2013 to 8.7 kg in 2017, and by 2023 it reached a record of 12 kg, representing an increase of more than 63%, as indicated by FIRA (2024) .
In the case of the state of Jalisco ( Figure 1 ), which is another state with a large population (+8.6 million people), under this model and with the identification of its production, it is a self-sufficient state that can supply this fruit to its territory and can also supply six other neighboring and northern states that have a deficit of the fruit, given the transportation costs optimized with the proposed model.
For the best optimization of this model, important requirements must be met within the avocado supply chain so that it reaches the demanding markets; as Sánchez-Valdés and Sánchez-Rodríguez (2021) point out, cluster integration and supply chain efficiency ( Coyle et al ., 2013 ) are a starting and important point for the product to reach the different national markets that know this product.
The optimization model based on linear programming minimizes transportation and distribution costs; however, its application in practice can excessively simplify the complexity of the logistics system within the supply chain. Studies such as that by Meléndez-Bermúdez (2020) show that route optimization can reduce costs by up to 30%, which shows the usefulness of these models.
Research such as that by Franco-Sánchez et al . (2018) indicates that the competitiveness of the avocado sector in Mexico also depends on multiple external factors, including market, production costs, and structural conditions. Likewise, Reyes-Gómez et al . (2024) highlight that the avocado value chain in Mexico has structural limitations that hinder logistics efficiency and that sustainability is a challenge.
An important axis in transport modeling is the emphasis on product traceability; some producers have chosen to use digital systems to improve transparency and reliability in distribution, to prioritize the risks identified in the distribution process, and to make supply chain optimization more sustainable ( Younis et al ., 2020 ).
Applying the Simplex Method to optimize avocado distribution in Mexico allowed us to identify more efficient logistics configurations, resulting in a significant optimization in transportation costs and improved allocation of available resources. This approach demonstrated that linear programming is an effective tool for decision-making in agrifood systems, especially in supply chains where multiple origins, destinations and operational constraints are involved.
On the other hand, it was found that the simplex model has limitations because it does not account for dynamic factors typical of real-world logistics, such as demand uncertainty, transport conditions, route safety and the product’s perishable nature. In this sense, although the model provides an optimal solution from a mathematical point of view, its practical application may be limited if it is not complemented with more robust approaches that integrate these variables.
Of the supplying states, Jalisco must supply some of the deficit states in the northwest; Michoacán supplies 23 states, supplying almost 88% of the deficit markets; Morelos and Nayarit satisfy a part of the markets of Guerrero and Sonora, respectively. Considering the presented scenarios, it is proposed, as lines of research, that the institutions immersed in the supply chain of this product system identify strengths and weaknesses in their distribution according to their consumption and thus identify public policies for improving infrastructure, laws and regulations necessary for the supply of this important fruit produced in Mexico.
This is especially relevant for avocados, where sustainability, cold chain efficiency and loss reduction represent key challenges to ensuring long-term efficient and competitive distribution.
Ayansola-Olufemi, A.; Oyenuga-lyabode, F. and Abimbola-Latifat, A. 2015. Comparative Study of Efficiency of Integer Programming, Simplex Method and Transportation Method in Linear Programming Problem (LPP). American Journal of Theoretical and Applied Statistics. 4(3):85-88. https://doi.org/10.11648/j.ajtas.20150403.13.
Chica-Mendoza, J. X.; Muñoz-Ríos, C. M.; Mera-Bravo, M. J.; Tuárez-Zambrano, G. M. y Macias-Barberán, J. R. 2024. Optimización de la cadena de suministro en la agroindustria de servicio alimentario: Supply Chain Optimization in the Food Service Agribusiness. Revista Científica Multidisciplinar G-Nerando. 5(2):458-485. https://doi.org/10.60100/rcmg.v5i2.282.
Reyes-Gómez, H.; Martínez-González, E. G.; Aguilar-Ávila, J. y Aguilar-Gallegos, N. 2024. Sistemas agroalimentarios sostenibles: el caso de la cadena de valor del aguacate en México. Problemas del Desarrollo. Revista Latinoamericana de Economía. 55(217):29-60. https://doi.org/10.22201/iiec.20078951e.2024.217.70098.
SIACON. 2024. Gobierno de México. Sistema de Información Agroalimetaria de Consulta. Reporte de índice de volumen físico de productos agropecuarios. Producción Agrícola. Plataforma de Información Digital: https://www.gob.mx/agricultura/dgsiap/prensa/sistema-de-informacion-agroalimentaria-de-consulta-siacon?idiom=es.