elocation-id: elocation-id: e4128
Wind speed is a climatic variable that conditions irrigation efficiency in sprinkler systems. Its measurement and monitoring are limited at Mexico’s meteorological stations. This work aimed to estimate wind speed at the crop level (1-3 m) using wind data from sensors in the Mexican Wind Atlas to evaluate the efficiency of the high-pressure sprinkler irrigation system in module 6 La Ventosa of DR 019 Tehuantepec, Oaxaca, Mexico. The work was conducted in 2004 using databases from the anemometric station of the Regional Wind Technology Center and a generalized additive model to define its profile and determine wind patterns. An irrigation system was experimentally evaluated under the site’s operating conditions, in accordance with the regulations. The results indicate that variability in speed makes it difficult to obtain an average value of wind speed. During the heat wave, a significant increase in the magnitude of wind speed was observed (above 9 m s-1). Under the conditions evaluated, the irrigation efficiency of the fixed high-pressure sprinkler system is 60%, which is within the average. Wind speed is at the core in estimating sprinkler irrigation efficiency; a better assessment requires direct experimental measurements in the growing area. Estimating wind speeds and directions provides information for the design and operation of the irrigation system in order to increase efficiency.
efficient use of water, logarithmic profile, uniformity of irrigation distribution, wind speed.
In order to reduce water consumption in the agricultural sector, actions such as the search for gauging devices for volumetric water delivery and the improvement of irrigation water efficiency are topics on the current agenda in water policy. Water for irrigation constitutes 70% of water withdrawals and contributes 40% of food worldwide, so investment in irrigation technologies aims to increase application efficiency and thus contribute to maintaining yields with the lowest use of resources, in this case water ( Grafton et al ., 2018 ).
The increase in the efficiency of irrigation systems is an achievement in the technification of irrigation, thereby maximizing uniformity of water distribution to plants in space and time ( Bjorneberg et al ., 2020 ; Salvatierra-Bellido et al ., 2018 ). Sprinkler irrigation is considered suitable for grain crops (Abd El-Wahed et al., 201 6 ). The most important disadvantage of sprinkler irrigation compared to drip irrigation is application uniformity as a function of wind conditions and the method used to determine it ( Salvatierra-Bellido et al ., 2018 ).
The parameters to be considered in evaluating the sprinkler irrigation system are mainly discharge speed, wetting radius, distribution pattern, application speed and droplet size, which are conditioned by wind speed; therefore, recommendations are made for soil type, crop and operating conditions ( Saccon, 2018 ). Application efficiency depends on the type of system, so the ranges for sprinkler systems can vary between 60 and 80% (Stambouli et al., 201 3 ).
Overlapping uniformity and droplet-size distribution are generally used to evaluate, classify, and improve the efficiency of sprinkler irrigation systems ( Zhu et al ., 2021 ). Irrigation uniformity, wind drag losses, and evaporation losses are the critical variables in the operation of sprinkler irrigation systems (Yacoubi et al., 201 2 ). Distribution uniformities of 50% reduce all bioproduction parameters in crops ( Contreras et al ., 2020 ).
The most relevant climatic factor in the water distribution pattern in sprinkler irrigation is wind and its speed, direction, and persistence must be considered for its design and operation ( Cisneros-Zayas et al ., 2019 ), which implies the uniformity of water distribution (Merriam and Keller, 1978; Dechmi et al., 200 3 ). The disadvantage of this factor is that there is no reliable, distributed information on the speed values in the cultivation area, so in most cases, statistical interpolation methods are used for evaluation.
In Mexico, there is dispersion and a lack of continuous wind data, which limit the use of numerical climate and atmospheric prediction models (Thomas et al., 2021). Research such as that by Morales-Ruvalcaba et al. (2020); Thomas et al. (2021) use tools such as ERA-5 fifth-generation atmospheric reanalysis of the European Centre for Medium-Range Weather Forecasts (ECMWF), produced by the Copernicus Climate Change Service (C3S, data from 2005 to 2007 at 80 m altitude every 10 min), the modern-era retrospective analysis for research and applications, Version 2 MERRA-2 (data from 2004 to 2008 at 10 to 80 masl every 10 min), and stations of the 2012 set up by the United Nations Development Program on Global Environmental Finance (UNDP-GEF) and the National Institute of Electricity and Clean Energy.
Among the numerical alternatives for analyzing wind speed is the use of the generalized linear mixed model. Mixed models are used when several records in a database are generated from one sampling unit (Correa-Morales and Salazar-Uribe, 201 6 ). Basic situations that produce database structures grouped into hierarchical random processes, which involve subsampling, splitting and random selection of treatments or blocks, and the use of longitudinal data, which in turn implies variation in time, space or both.
Fixed effects are considered to be self-determined and do not represent external effects (Correa-Morales and Salazar-Uribe, 201 6 ). The two-stage model is a technique for describing data with basic summary statistics (Correa-Morales and Salazar-Uribe, 201 6 ). Stage 1 fits a model for each piece of data separately. Stage 2 explains the variability in regression coefficients, using fixed effects.
In Irrigation District 019, Tehuantepec, Oaxaca, Mexico: CONAGUA implemented, from 2018 onwards, an irrigation technification program through the hydro-agricultural infrastructure support program ( CONAGUA, 2020 ); pressurized irrigation systems were installed in its modules, including module 6 ‘La Ventosa’. In the region known as La Ventosa, Oaxaca, there is a phenomenon of channeled winds called ‘Paso de Chivela’; the particular topography of the Isthmus of Tehuantepec causes very strong wind speeds to be concentrated in Paso de Chivela ( Wang et al ., 2018 ).
These high wind speeds are known in Mexico as ‘northerly winds’ or ‘tehuanos’ ( Morales-Ruvalcaba et al ., 2020 ). This work aimed to estimate wind speed at the corn-crop level and to evaluate its effects on sprinkler irrigation efficiency variables, primarily distribution, under production conditions in Irrigation District 019, Tehuantepec.
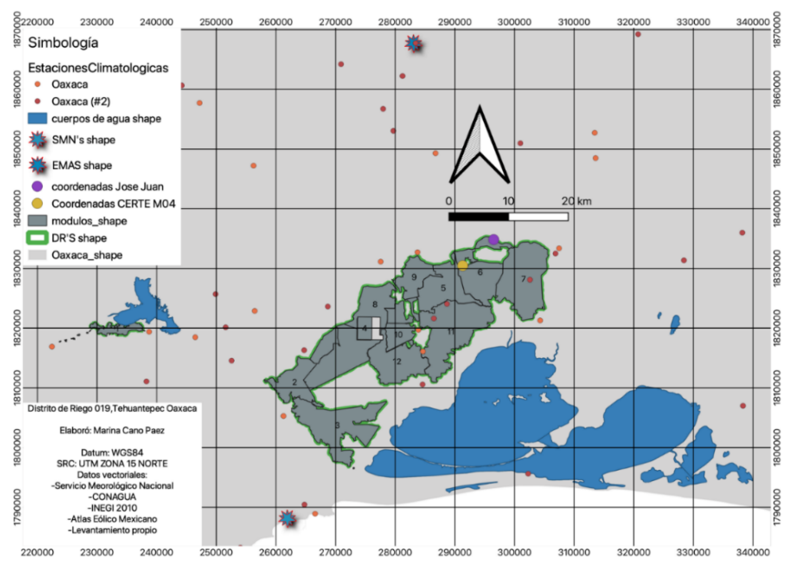
Irrigation District 019, Tehuantepec, Oaxaca, has an area of 20 242 ha, is located in the southern part of the Isthmus of Tehuantepec, Mexico ( Figure 1 ), covers the municipalities of Santa María Mixtequilla, Santo Domingo Tehuantepec, Villa de San Blas Atempa, San Pedro Huilotepec, San Pedro Comitancillo, Asunción Ixtaltepec, El Espinal, Juchitán de Zaragoza and Unión Hidalgo, between coordinates 16° 14’ and 16° 34’ north latitude and 94° 50’ and 95° 32’ west longitude. It consists of 12 irrigation modules and an URDERAL.
The tests were conducted in a plot in module 6, La Ventosa, in the municipality of Juchitán, with the coordinates 16° 34’ 46.26” north latitude and 94° 52’ 2.98” west longitude. The region is characterized by its warm subhumid tropical climate, close to dry, with summer rainfall and an average annual temperature of 27 °C. Its average annual rainfall is 835 mm, and its average annual evaporation is 1 834.05 mm. Tehuano winds or northerly winds are present in this module. The field tests were designed according to local sprinkler practices: operating pressure range at the head and spacing between local sprinklers in the plot.
Statistical wind analysis. The statistical models used in this work were two-stage GAMs (equation 2.1 3 ) (Correa-Morales and Salazar-Uribe, 201 6 ); the wind analysis consisted of predicting wind behavior from weather data; the GAMs in this study were time series of the variable wind; its behavior was analyzed for readings every 10 min, hourly, daytime, weekly, monthly and annually.
In the first stage, each reading was adjusted separately according to the logarithmic profile to obtain the wind speed at heights of 0.5, 1 and 1.5 m, using the Mexican Wind Atlas database for the M4 CERTE station. The readings measured by tower A at a height of 80 m were selected to perform the logarithmic regression, along with the wind speeds at 60, 40 and 20 m; a fifth height at 0 m was included, with the wind speed set to zero.
The response variables were wind speed and direction, and the predictive variables used were the date, hour, and minute. The prediction was made using the results of the analysis of data grouped by daily average, maximum and minimum; the wind speed was declared as a time series in the R software, and its model assumed a Gaussian or normal distribution of errors; finally, the smoothing functions ‘s’ ensured the analysis of annual, monthly and daily behavior. R is a language for statistical and graphical analysis. It is a programming environment made up of a set of highly flexible tools that can be easily extended through packages, libraries or user-defined functions.
In addition, it is free and open-source, part of the GNU project, like Linux or Mozilla Firefox. The wind measurement database of the M04 Certe region was obtained from the Mexican Wind Atlas ( Miranda and Saldaña, 2019 ) and the station is located in the municipality of Juchitán, 7 km from the experimental plot. The following packages were used in Python for statistical analysis: Pandas, Numpy, Datetime, Matplotlib, and Windrose ( Harris et al ., 2020 ; Quick et al ., 2020 ; Reback et al ., 2020 ; Caswell et al ., 2021 ); likewise, measurements from 2018 were used.
Sampling for irrigation system evaluation. In June 2020, an unrestricted random sample was taken from five irrigation systems located in the modules, number 3: San Blas Atempa, number 5: El Espinal and number 6: La Ventosa. The following characteristics were recorded: height, diameter and material of the sprinkler riser pipe, and type of sprinkler used.
Proportional sampling formulas were used to estimate the characteristics of most sprinkler irrigation systems installed in the district. was defined as the characteristic observed in the five irrigation systems: height, diameter and material of the riser pipe, and type of sprinkler. was defined as the characteristic observed in the five irrigation systems, different from the characteristics mentioned in the previous paragraph.
Equation 1 shows the formula for the estimated variance of the characteristic
1); formula 2 infers the error bound of the estimate with the sample
2 ), and equation 3 allows estimating the confidence interval of the sample estimate
3 ). Where: n is the sample size of sprinkler irrigation systems; N is the population size of sprinkler irrigation systems in the irrigation district; B is the limit of error; and CI is the confidence interval.
Calculation of irrigation uniformity. The evaluation of irrigation uniformity was conducted on uncultivated soil, selecting a middle section in accordance with the sprinkler irrigation evaluation methodology ( Merriam and Keller, 1978 ). A grid of rain gauges spaced 3 m apart was established in accordance with international standards ( ISO 7749-2, 1990 ; ISO 15886-3, 2021 ).
The vessels were made of plastic, measuring 120 mm in height and 95 mm in diameter. The sprinklers were spaced 30 m apart, with two operating simultaneously. The sprinklers operated for 1 h; the volume collected by each vessel was measured with a 50 ml graduated cylinder, and the sprinkler operating pressure was measured with a glycerin pressure gauge.
The climatological variables: temperature (°C), wind (m s-1), and relative humidity (%) were measured every 15 min during the tests at a distance of 2 m above the ground surface. The volume of water collected by each vessel was recorded in a database and used to determine the irrigation uniformity parameters. Christiansen’s distribution uniformity coefficient.
Equation 4 is used to calculate the distribution uniformity coefficient (DUC) developed by Christiansen ( ISO 7749-2, 1990 ):
4 ). Where: DUC is the distribution uniformity coefficient; n is the number of readings; is the individual reading of each collector; is the sum of the absolute value of the standard deviations from the mean.
Merriam and Keller distribution uniformity. From equation 5, it is possible to calculate the distribution uniformity ( Merriam and Keller, 1978 ):
5 ). Where: V(25%) is the volume collected in the bottom quarter of the volumes collected; Vm is the average volume collected by all the vessels in the grid.
Coefficient of variation. The coefficient of variation (equation 6 ) is calculated as the standard deviation of all collection vessel measurements divided by the average đ (Abd El-Wahed et al., 2016):
6 ). Where: is the standard deviation associated with the measurements of the collection vessels.
Statistical analysis. The experimental design is a 23 full factorial design, with the factors being the nozzle diameter of each working sprinkler (12, 14, 16, 18, 20 and 22 mm), each with three levels, corresponding to the variables: temperature, wind speed and relative humidity. The response variables defined above DUC, DU and CV were used to conduct an Anova to analyze them.
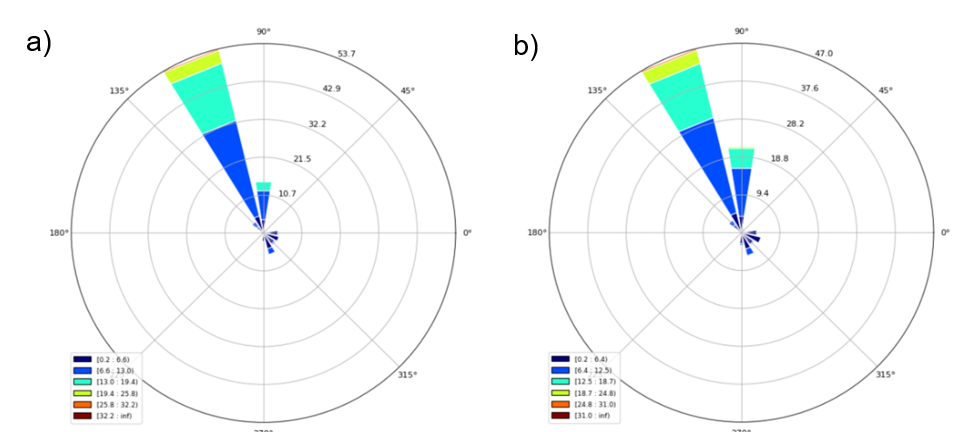
The data on the direction observations measured at the M04 Certe station, Oaxaca, correspond to heights of 78 m and 58 m (Figure 2 ); the predominant direction for the total readings in Juchitán is that of the tehuano, or northerly, winds from the north-northwest.
Fifty-three percent of the measured wind speeds had a NNW direction; these wind speeds ranged from 0 to 43 m s-1(Figure 2 ); of these, the magnitudes of 30% of the measured speeds were in a range of 0-13 m s-1; 15% were in a range of 13-19.5 m s-1; a percentage of less than 5% corresponded to speeds in a range of 19.5-26 m s-1, and an even lower percentage corresponded to the maximum speeds recorded; 10% of the speeds from 0 to 12 m s-1had a purely northward direction. Percentages close to 5% had E, ESE, SE, SSE and NW directions, with speeds less than 6.6 m s-1.
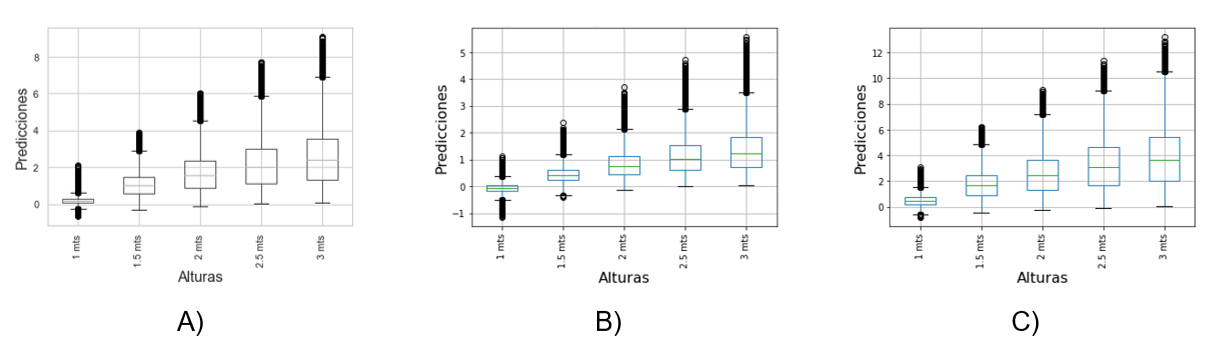
The velocities calculated within the first 10 m above the ground surface using the coefficients a and b exhibited distributions in which the interquartile range widened with increasing height (Figure 3 ).
Using wind speed estimates for the crop area, the uniformity and irrigation efficiency parameters of the systems evaluated in the field are estimated based on Kelly’s methodology. For irrigation uniformity, the sample size for the population of sprinkler irrigation systems in Irrigation District 019, ‘n’, was five; based on this number, the parameters were estimated to evaluate uniformity, following the methodology described in the corresponding section.
Table 1 presents the physical characteristics of the evaluated systems. It should be noted that, for the purposes of this work, only the evaluation of irrigation efficiency is considered, without accounting for the energy source to activate these systems. This is because there are different power sources ( Table 1 ); however, the same procedure was used to capture the ‘rainfall’ from the high-pressure sprinkler on the plot, regardless of the drive system or the type of crop (or absence of crop, as in case 1).
It was observed that the five irrigation systems have the same characteristics described: a 2-inch riser pipe, covered with concrete up to the point before its valve; the sprinkler was a giant gun in the large-flow category, with jet dispersion driven by a water turbine ( Ge et al ., 2020 ), brand Yuzuak, model Jet-40.
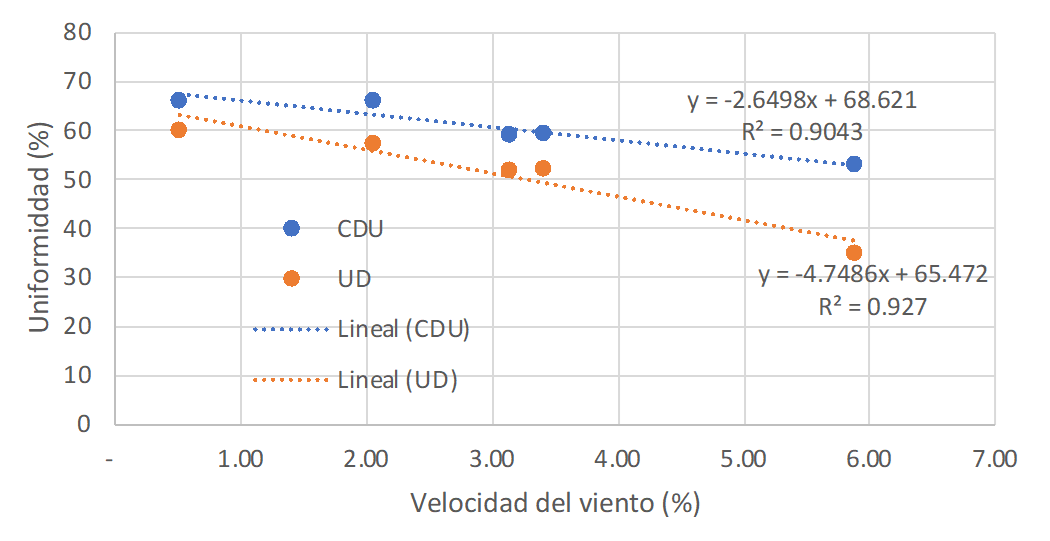
The results of the evaluation of the irrigation systems are summarized in Table 2 . With the parameterization of irrigation uniformity in the high-pressure sprinkler mode, it is possible to observe a decrease in irrigation uniformity as wind speed increases. This is consistent with the results for irrigation systems whose dispersion is through wind or depends on this variable.
Figure 4 schematically presents the integrated relationship between wind speed and irrigation uniformity for the evaluated systems, which can be extrapolated to the Irrigation District. The irrigation uniformity of the system with Yuzuak Jet 40 sprinklers is linear and negative, regardless of whether only one or two sprinklers are operating simultaneously.
This result is, to a certain extent, logical, but there is now a basis for saying that an increase in wind speed during the operation of sprinkler irrigation systems with these characteristics reduces uniformity. Even at wind conditions of less than 2 m s-1, they cause uniformities of less than 70%. Nevertheless, the fact that this linear relationship has been found does not imply that it is always so; Martín-Benito (200 5 ) found non-linear relationships between the uniformity of sprinkler irrigation and wind speed. Wind at a speed of 2 m s-1changed the water distribution pattern, resulting in specific concentrations of water.
One reason the water distribution model was observed to be non-uniform when two high-pressure sprinklers operated simultaneously is that the sampled irrigation system does not comply with the Official Mexican Standard ( NMX-O-177-SCFI-2011, 2011 ) regarding sprinkler spacing, according to the high-pressure sprinkler model’s wetting diameter and the wind speed estimated at 2 m height. This result may be due in part to the lack of wind data measurement within DR 019.
It should be noted that the wind direction was not considered because it was not measured during the tests. The lack of overlap between two sprinklers operating simultaneously is due to the sprinklers with 18 mm nozzles having a 38 m radius and requiring a pressure of 5.88 bar, which was not achieved in the field. The performance of the irrigation system could be improved by upgrading the equipment that powers the pump. This would also improve the water application by the sprinklers and the uniformity of irrigation.
The minimum wind speeds occur in summer in June, whereas the maximum wind speeds occur in January. The period of high wind speeds coincides with the irrigation district’s period of water delivery to users; therefore, it is necessary to analyze wind influence on wind distribution parameters and based on them, propose the optimal sprinkler distribution, whether current or future.
The sampling carried out on the sprinkler irrigation systems of the DR can be considered a pilot study; therefore, the inference on the sprinkler irrigation systems used in the DR was representative in terms of sprinkler characteristics, sprinkler carrier pipes and height of the sprinkler riser pipe, but not representative in terms of the type of pump used by the irrigation systems.
If one wants to deepen future studies of the types of pumps used in the DR, it is recommended to take into account the results of the sampling carried out in this research and the sampling techniques used to determine the ideal sample size of irrigation systems. This will enable more accurate inferences about the pumping equipment used in these types of irrigation systems in the DR.
We are grateful to Dr. Osvaldo Rodríguez Hernández of the Institute of Renewable Energies of UNAM for the information from the Mexican Wind Atlas.
Caswell, T. A.; Droettboom, M.; Lee, A.; Andrade, E. S.; Hoffmann, T.; Hunter, J.; Klymak, J.; Firing, E.; Stansby, D.; Varoquaux, N.; Nielsen, J. H.; Root, B.; May, R.; Elson, P.; Seppänen, J. K.; Dale, D.; Lee, J. J.; McDougall, D.; Straw, A.; Hobson, P.; Hannah; Gohlke, C.; Vincent, A. F.; Yu, T. S.; Ma, E.; Silvester, S.; Moad, C.; Kniazev, N.; Ernest, E.; Ivanov, P. 2021. Matplotlib/matplotlib: REL: v3.5.0. https://doi.org/10.5281/ZENODO.5706396.
Harris, C. R.; Millman, K. J.; Van der Walt, S. J.; Gommers, R.; Virtanen, P.; Cournapeau, D.; Wieser, E.; Taylor, J.; Berg, S.; Smith, N. J.; Kern, R.; Picus, M.; Hoyer, D. S.;Van Kerkwijk, M. H.; Brett, M.; Haldane, A.; Fernández del Río, J.; Wiebe, M.; Peterson, P.; Gérard-Marchant, P.; Sheppard, K.; Reddy, T.; Weckesser, W.; Abbasi, H.; Gohlke, C. and Travis E. Oliphant. 2020. Array programming with NumPy. Nature. 585:357-362. https://doi.org/10.1038/s41586-020-2649-2.
Reback, J.; McKinney, W.; Bossche, J.; Augspurger, T.; Cloud, P.; Klein, A.; Roeschke, M.; Tratner, J.; She, C.; Ayd, W.; Hawkins, S.; Petersen, T.; Schendel, J.; Hayden, A.; Garcia, M.; Jancauskas, V.; Battiston, P.; Seabold, S.; Hoyer, S.; Overmeire, W.; Mehyar, M.; Whelan, C. and Kluyver, T. 2020. Pandas-dev/pandas: Pandas 1.0.0. https://doi.org/10.5281/ZENODO.3630805.