elocation-id: elocation-id: e4076
Guava is a fruit widely accepted worldwide and in 2023, Mexico consolidated its position as the second-largest global exporter, with a value of 577 934.18 USD, confirming its high international competitiveness. The research aimed to analyze the competitiveness of Mexican guava in international trade, identifying its position and formulating alternatives that strengthen its insertion into international trade. The research was conducted by calculating growth rates and trade competitiveness indices for the period 2000-2023, using production and foreign trade data. The results showed that the indicators were positive: the trade balance remained at 1, which confirms that Mexico is an exporter with competitive advantages; the tradability indicator was 0.34, evidencing an excess of exportable supply; the trade dependence coefficient was 0, which reflects food self-sufficiency; and the degree of export openness reached 0.035, pointing out the existence of exportable surpluses. Overall, these results indicate that guava production in Mexico is expanding, with a marked export specialization and a solid competitive position in the international market.
exports, guava, imports, production, trade balance.
Guava (Psidium guajava L.) is a tropical fruit of great economic and nutritional importance, native to America and with a notable productive concentration in Mexico in Michoacán, Aguascalientes, Zacatecas, State of México and Guerrero (FAOSTAT, 2023); it is widely distributed in tropical and subtropical regions of the world.
It is currently grown in around 97 countries, consolidating its position as one of the most important fruits in the international trade of fresh agricultural products (SIAP, 2023). Regarding world production, Mexico ranks seventh, with a 3.6% share of the global total (FAOSTAT, 2023).
The state of Michoacán stands out as the largest national producer, contributing approximately 48.2% of total production, especially during the seasonal production from October to December, when about 41% of the annual volume is obtained (SIAP, 2023). This seasonal pattern responds to the region’s favorable agroclimatic conditions, which enable high-quality production for both domestic consumption and export.
Regions such as Michoacán, Jalisco, and Sonora have shown a strong specialization in the production and marketing of fruits destined for the international market, which shows the importance of the fruit and vegetable sector for regional and national development (Secretaría de Agricultura y Desarrollo Rural, 2024); the main export destinations of Mexican guava include the United States of America, Japan, Russia, and various European countries, reflecting the growing international demand for exotic and healthy fruits (FAOSTAT, 2023).
From a nutritional perspective, guava is characterized by its high content of carbohydrates (13.2%), moisture (84.9%), proteins (0.88%) and fat (0.53%). This makes it an important source of energy and essential micronutrients (Suárez et al., 2022). Likewise, its chemical composition gives it properties that contribute to strengthening the immune system and preventing respiratory diseases.
According to Montaño et al. (2021), Mexico has favorable conditions: climate, natural resources, labor availability and geographic proximity to the US market, which is considered the largest in the world.
This paper focuses on evaluating the level of competitiveness of Mexican guava (Psidium guajava L.) in international trade and determining whether Mexico maintains competitive advantages and a solid insertion in foreign markets in a context of growing global competition.
Unlike previous studies, this work combines the analysis of growth rates with various indicators of trade competitiveness, allowing us to fully understand the product’s export performance.
A database was built with information on the production and trade variables of guava (Psidium guajava L.) corresponding to the period between 2000 and 2023; this time interval allows us to analyze the evolution of production, foreign trade and competitiveness of the sector in the long term and identify trends and recent performance that has contributed to the consolidation of Mexico as one of the largest exporters at the national level.
Data collection was carried out using Microsoft Excel spreadsheets and official and nationally and internationally recognized sources, such as the Food and Agriculture Organization of the United Nations (FAOSTAT) and the Agrifood and Fisheries Information System (SIAP, 2024).
Based on the information obtained, various economic and productive indicators were calculated in order to analyze the export feasibility of Mexico’s guava-growing sector. The indicators considered were: trade balance (TB), national apparent consumption (NAC), tradability indicator (T), trade dependence coefficient (DI) and indicator of degree of export openness (DE).
These indicators help us evaluate the sector’s competitiveness because they comprehensively capture its productive and commercial performance. The trade balance (TB) reflects the net export capacity and the existence of competitive advantages in the international market; the national apparent consumption (NAC) allows us to analyze the sufficiency of domestic production in relation to demand; the tradability indicator (T) measures the proportion of production destined for export, evidencing the orientation of the sector towards the external market; the trade dependence coefficient (DI) assesses the degree of dependence on imports, which is associated with productive sufficiency; and the degree of export openness (DE) shows the insertion of the sector in international trade (Balassa, 1965; Vollrath, 1991; Avendaño and Schwentesius, 2016; Cruz et al., 2022).
It is one of the fundamental macroeconomic indicators for analyzing a country’s economic performance, as it reflects the net value of international transactions of goods carried out during a given period. It represents the difference between a nation’s exports (sales of goods abroad) and imports (purchases of goods from abroad) (Krugman and Obstfeld, 2018); (Durán and Álvarez, 2008). The following equation expresses the calculation of the trade balance:
Where: TB= represents the trade balance; X= represents the exports of goods; and M= represents imports of goods.
If TB > 0, there is a trade surplus, indicating that the country exports more than it imports. If TB < 0, there is a trade deficit, a situation in which imports exceed exports. If TB = 0, the balance is considered to be balanced, with an equal trade exchange.
Analysis of the trade balance allows the competitiveness of the productive sectors to be evaluated and influences certain variables; a constant surplus reflects a comparative advantage in terms of climate and natural resources to compete globally (Balassa, 1965).
National apparent consumption (NAC) is a macroeconomic indicator that allows us to estimate the total availability of a good or product within a country over a given period. It reflects the amount of good that can potentially be consumed by different national economic agents, including households, companies and public institutions (Ramirez et al., 2016).
The national apparent consumption is calculated using the following expression:
Where: P= represents the national production of goods in the period of analysis; M= corresponds to imports, which increase domestic availability; and X= denotes exports, which reduce the supply available in the domestic market.
It is an analytical tool used to assess the trade position of a specific country, sector, or product, considering the balance between exports and imports in relation to total trade. It allows us to determine whether the country has an export or import tendency. RTB is calculated based on the following expression:
Where: Xi= represents the value of exports of the product or sector i; Mi= corresponds to the value of imports of the same product or sector (Ramírez et al., 2016).
It allows us to evaluate the extent of a product or sector’s orientation toward foreign trade. It is obtained from the relationship between the trade balance and the value of national apparent consumption. TI is calculated using the following expression:
Where: Tij= tradability indicator; Xij= exports of product i by country j to the world market; Mij= imports of a product i by a country j from the world market or a specific market; Qij= domestic production of product i by country j (Cruz et al., 2022).
It is a fundamental economic indicator that helps assess the degree to which an economy depends on foreign trade. This coefficient reflects the proportion of gross domestic product (GDP) directly linked to a country’s export and import operations, providing a quantitative measure of the level of trade openness and international economic integration (González and Ramírez, 2023).
As the coefficient increases, the greater the dependence of domestic consumption on imports (Pat et al., 2014). Conversely, a lower coefficient indicates that the country has greater capacity to meet its domestic demand through domestic production. When the indicator is expressed in a range of 0-1, values close to zero reflect greater competitiveness of the sector or production chain, since imports tend to be minimal or even zero (Pat et al., 2017).
Where: TDCij= degree of trade dependence on product i in country j; Mij= imports of product i by country j; Xij= exports of product i by country j; and Yij= domestic production of product i by country j.
It is a macroeconomic indicator that allows us to evaluate the level of insertion of an economy in international trade, specifically concerning its ability to place goods and services in the markets of international economy and economic development, because it allows us to identify the degree of dependence of an economy on its exports as a source of income and growth (Cruz et al., 2022).
Its calculation is given by the following formula:
Where: DEij= degree of export openness; Xij= exports of product i by country j; Mij= imports of product i by country j; Qij= domestic production of product i by country j (Ramírez et al., 2016; López and Ramírez, 2021).
The data in Table 1 show important differences between economies, reflecting not only their level of development, but also their ability to integrate into global markets. Thailand leads global guava exports, followed by Mexico with 577 934.18 USD (FAOSTAT, 2023). Both countries stand out for their roles as producers and logistics centers, capable of maintaining diversified and export-oriented production.
Table 2 shows export values, expressed in US dollars (USD), for the year 2023 for the eleven main countries. These variations in exports can be explained by factors such as economic infrastructure, foreign investment, available technology and trade policies of each country (Krugman and Melitz, 2018). The leadership of Thailand and Mexico suggests a consolidation, consistent with the processes of economic regionalization.
In 2023, the international guava trade continued to gain relevance as a part of the global tropical fruit market. This product, recognized for its high nutritional value and growing demand for healthy diets, has found an increasingly wide space in the world’s major economies (FAOSTAT, 2023). The Table 2 shows that the United States of America is the leading importer, with a total value of 889 339.77 USD, followed by China, with 741 370.14 USD and the European Union, which reached 665 826.27 USD.
These three regions account for most of the world’s demand, reflecting their consumption capacity and central role in the distribution of agricultural products of tropical origin. The figures show that guava remains a niche product, concentrated in developed markets with high purchasing power and well-established logistics chains. This concentration is consistent with international trade theories, which explain how producing countries, mostly tropical, export agricultural goods to advanced economies that lack the necessary climatic conditions to produce them but have the infrastructure and demand to consume them (Pariona, 2022; Pansara and Vaghasiya, 2025).
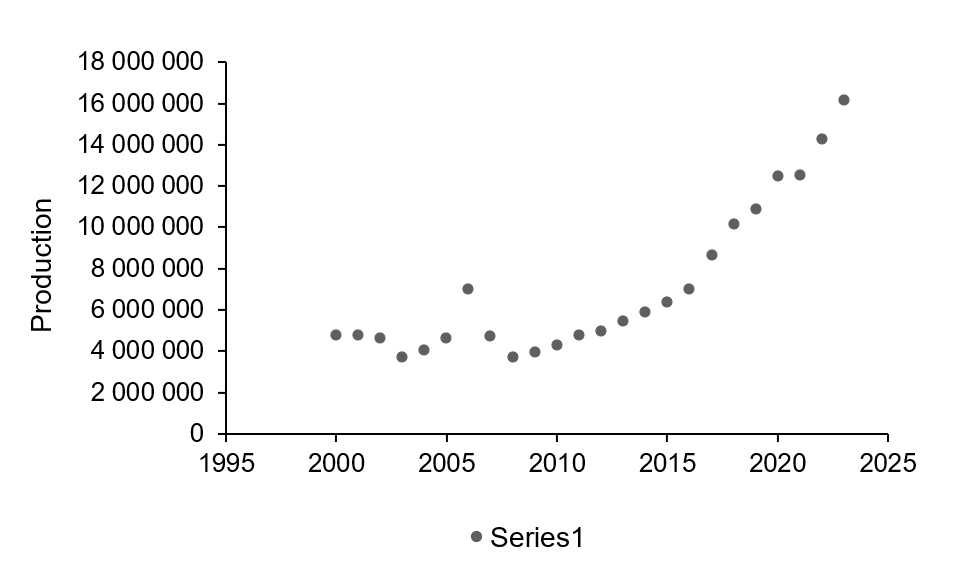
Over the past two decades, Mexico has consolidated its position as one of the world’s leading guava producers and exporters, thanks to the work of producers (Gutiérrez et al., 2023), the adoption of agricultural technology and the opening of new markets. Between 2000 and 2023, national guava production showed a steady upward trend (Figure 1).
According to data from SIAP (2024), the cultivated area went from about 17 000 ha to more than 25 000 ha and production volume exceeded 300 000 t per year by 2023. The country’s guava production is located in the center-west, with Michoacán, Aguascalientes, Zacatecas and Nayarit as the largest producing states. These regions not only stand out for their favorable agroclimatic conditions, but also for the experience and organization of their producers (Suárez et al., 2022).
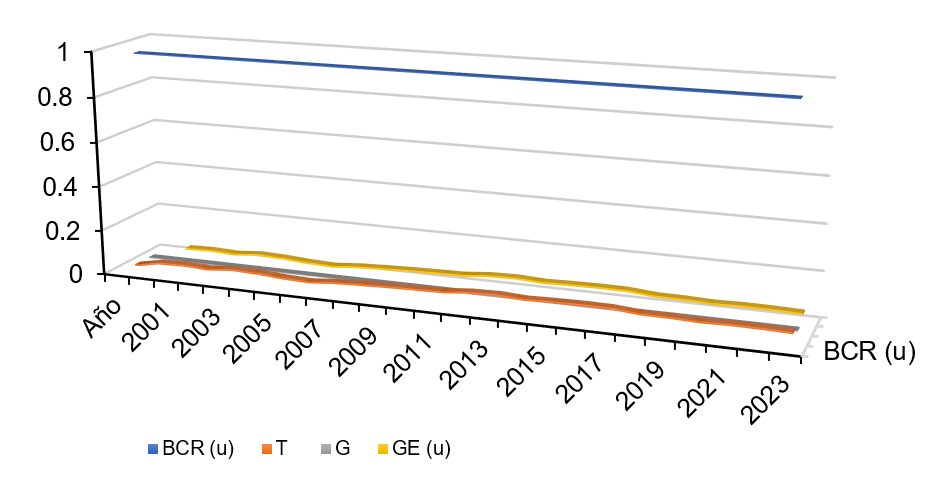
Mexico has shifted from being a producer mainly oriented toward domestic consumption to consolidating itself as a competitive exporter in the global guava market, with a 31.8% increase in export volume (SIAP, 2024). In 2023, a point of maturity is established because markets are more diverse and demand more, there is a high degree of sophistication and the demand for quality is higher every day (FAO, 2023) (Figure 2).
The indicators RTB(u), T(u), D(u) and DE(u) were evaluated in the years 2000-2023, where RTB(u) remained constant at 1 and the behavior of T(u) and DE(u) reflects the efficiency or performance of the system over time; from 2000 to 2006, T(u) reaches a consolidation phase, in which it can be seen that it begins to stabilize and from 2007 to 2013, there is a sustained expansion, with continuous growth, reaching its peak in 2013 (0.052) (Table 3).
This period represents a stage of expansion that could be driven by technological innovation and trade liberalization processes. From 2014 to 2017, the indicators remained stable, with values close to 0.05 and there is evidence of a balance in operational efficiency (Table 1). From 2018 to 2023, the values began to decrease slightly, going from 004 in 2018 to 0.034 in 2023. This reduction indicates a slowdown in overall efficiency, possibly influenced by external factors such as increased logistics costs, market fluctuations, or climatic impacts that affected productivity (Table 3).
The growth of Mexican guava exports responds to a combination of technological innovation and well-articulated production strategies (Espinosa and Martínez, 2021). The main factors that have driven this development are the following: 1) trade liberalization through bilateral treaties and agreements (USMCA and Agreement with the European Union and Asia-Pacific); 2) quality and safety certifications, which are tools based on international standards of safety, sustainability and traceability; and 3) technological innovations in post-harvest and transport.
It is necessary to continue investing in technology, certification, and added value, so that Mexican guava maintains its position as an emblematic, profitable and sustainable fruit on the international stage (Quintero et al., 2020).
The results obtained show that world guava production has maintained a sustained growth, reaching 16.21 million tonnes. The participation of countries such as Thailand, Indonesia and India suggests that agroclimatic conditions, combined with agricultural modernization, have been decisive for their global positioning.
Mexico consolidates its position as the second-largest exporter of guava, with an export value of 577 934.18 USD in 2023, which confirms that it is a competitive product at the international level (FAO, 2023); these results coincide with the trend reported by Krugman and Obstfeld (2018), who highlight that economies with adequate technological capacity and infrastructure manage to integrate more efficiently into global markets.
The international guava market shows significant demand concentration in developed economies, mainly the United States of America, China, and the European Union, which confirms the niche nature of this product. The results reflect that Mexico has reached a productive maturity in guava cultivation, driven by the experience of its producers, favorable agroclimatic conditions, and the use of trade liberalization policies.
The maintenance of this competitiveness will depend on the ability to innovate in value-added processes (Porter, 1990; Notteboom and Rodríguez, 2021), optimize export logistics, and diversify export destinations (Bustos, 2011), in order to reduce dependence on a few markets and ensure the sustainability of long-term growth (Vorley et al., 2007).
In 2023, Mexico consolidated its position as the second-largest global exporter, with a value of 577 934.18 USD, confirming its high international competitiveness.
The analysis of guava (Psidium guajava L.) production and trade during the period 2000-2023 showed that Mexico has consolidated a strategic position in the global tropical fruit market, ranking as the second-largest global exporter, with a value of 577 934.18 USD. This performance confirms its high international competitiveness and shows that sustained growth of national production and expansion of exports reflect Mexico’s ability to adapt to the challenges of international trade through the adoption of technology, the organization of producers, and the diversification of markets.
The recent decline in the overall efficiency of the production system highlights the need to strengthen logistics infrastructure, foster technological innovation, and promote public policies that ensure the sector’s resilience to external factors such as climate change and price volatility.
In this sense, Mexican guava is emerging not only as a product of high commercial value, but also as a key element for sustainable rural development, as long as a comprehensive strategy aimed at quality, environmental sustainability and international competitiveness is maintained.
Durán, L. J. E. y Álvarez, M. 2008. Indicadores de comercio exterior y política comercial: mediciones de posición y dinamismo comercial. (Documento de proyecto LC/W.217). Comisión Económica para América Latina y el Caribe (CEPAL). 1(1):1-45. https://repositorio.cepal.org/bitstream/handle/11362/3690/S2008794-es.pdf.
Sangerman, J. D. M.; Larqué, S. B. S.; Navarro, B. A.; Rindermann, R. R. y Damian, H. M. A. 2013. Producción de guayaba ( Psidium guajava L.) y su importancia socioeconómica en México. Revista de Ciencias Agrícolas. 4(7):1081-1093. https://www.scielo.org.mx/scielo.php?script=sci-arttext&pid=S200709342013000700009 .
SIAP. 2023. Aumenta 8.2 por ciento la producción de guayaba en México en el último trienio. SAGARPA. SIAP. 2023. Servicio de Información Agroalimentaria y Pesquera. Estadísticas de producción agrícola y pecuaria de México . Secretaría de Agricultura y Desarrollo Rural (SADER). https://www.gob.mx/siap .
Vorley, B. W.; Fearne, A. S. Ray, D. 2007. Regoverning markets: a place for small-scale producers in modern agrifood chains? International Institute for environment and development. 1(1):14:48. https://obnb.uk/p13634022-regoverning-markets-a-place-for-small-scale-producers-in-modern-agrifood-chains?utm-source=chatgpt.com.