elocation-id: e4008
In Colombia’s rural sector, collective action presents itself as a fundamental axis for generating shared benefits and mobilizing territorial resources. In this framework, associativity represents a key strategy for strengthening it, especially in small-scale coffee-growing scenarios. In the Cauca Department, where 99% of coffee growers are small producers organized mostly in associative models, it is a priority to understand how associativity is configured and expressed in their organizational structures. This research aimed to estimate and apply the associativity index to three coffee growers’ organizations (ASOMEDACS, FCC, and ASPROSI) in order to understand the particularities of their collective dynamics. The study was conducted from 2023 to 2024, using a multiple case design with a mixed approach. A structured survey was administered to 38 coffee-grower leaders, based on ten indicators validated by institutional actors in the sector. The analysis integrated a weighted composite index and statistical tools (Anova and Tukey’s HSD test). The results revealed significant differences among the organizations, with ASPROSI standing out with the highest index (76.41), indicating greater internal cohesion, a solid organizational structure and participatory links. These findings suggest that a higher index of associativity may reflect a greater organizational capacity to generate collective action. The proposed methodology offers a replicable and relevant tool for evaluating organizational processes in rural territories and proposes a future line of research on the relationship between associativity and resource activation within the framework of localized agrifood systems.
associativity, coffee growing, collective action.
In the rural territories of Latin America, associativity has consolidated itself as a fundamental tool for strengthening the social fabric, improving living conditions, and promoting endogenous development. Partnering allows small-scale producers to face together the challenges of a changing, increasingly demanding environment and to generate economic, social, political and ecological benefits collectively (Amézaga et al., 2013; Fonseca-Carreño et al., 2020; Rodríguez-Herrera, 2020). In Colombia, coffee growing has been a key scenario for these dynamics, understood as organizational processes related to accountability, participatory leadership, strategic plan development, function assignment, internal governance, and project management.
Although there are more than 800 coffee-growing organizations in the country (FNC, 2019), belonging to an association does not guarantee efficient management by itself, as barriers such as limited access to technology, restricted financing, and difficulties in differentiated marketing persist. Even so, cooperativism and local networks have strengthened organizational processes in territories such as the Cauca Department. Cauca is located in the southwest of Colombia, where coffee is grown in 34 of its 42 municipalities and about 93 000 families have productive units of less than five hectares; that is, small-scale coffee growers who constitute 99% of the producers in a department that also ranks fourth in national production (FNC, 2022; FNC, 2024).
This diverse coffee growing, rooted in multicultural territories, is relevant both for its economic impact and for its potential to activate the territory’s resources through collective action. However, measuring the level of associativity and its capacity to activate territorial resources remains a challenge. Although there are studies on the subject, the methodologies used vary considerably. While some studies prioritize technical indicators such as yield or infrastructure (Barrera-Rodríguez et al., 2016; Araujo et al., 2021; Benavides-Santacruz et al., 2021), others assess relational indicators such as trust and a sense of belonging (González-Vásquez, 2018; Fonseca-Carreño et al., 2020).
This heterogeneity makes it difficult to compare experiences and limits the design of strategies tailored to specific contexts, which in turn can affect the articulation, coordination, and performance of the production chain in rural territories. Therefore, the study proposes a methodology that integrates social, organizational and technical dimensions into a composite index of associativity, adapted to the context of rural coffee-growing organizations. Using the same set of indicators and a relative weighting based on expert judgment makes it possible to compare organizational experiences and, at the same time, to identify particularities that guide strategies tailored to each territory. The objective was to estimate and apply this index to three case studies from the Cauca Department and to explore whether there are significant differences between the associativity indices in at least one of the organizations.
This research adopted a multiple-case study design with a mixed approach, ideal for analyzing phenomena whose richness lies not only in their statistical representativeness but also in their ability to offer substantive understanding and meaningful analytical comparisons (Gerring, 2007; Yin, 2009; Guntermann, 2013). Three small-scale coffee growers’ organizations in the Cauca Department were analyzed: Association of Entrepreneurial Women for Agricultural Development El Peñón Corralejas Sotará (ASOMEDACS, by its Spanish acronym), Peasant Federation of Cauca (FCC, by its Spanish acronym), and Association of Organic Producers of La Sierra (ASPROSI, by its Spanish acronym). The selection was based on productive, organizational, and institutional criteria, taking into account the associations’ geographical locations, trust relationships, and the feasibility of fieldwork.
Once the organizations were selected, a structured questionnaire was administered to coffee-grower leaders in order to calculate the associativity index. The instrument was designed based on the methodological proposal of Barrera-Rodríguez et al. (2016), adapted to the Cauca context through theoretical contributions that broadened its relevance. The associativity index was constructed from ten indicators that combine quantitative measurements based on network analysis, ordinal Likert scales, and quantitative variables associated with the adoption of innovations, allowing us to integrate the social, organizational and technical dimensions of associative functioning.
In this framework, the following items were considered: the degree of density among the associates (DDE), calculated by network analysis in UCINET (Borgatti et al., 2002) and expressed as a percentage of actual ties over possible ones, according to graph theory (Granovetter, 1979; Barnes and Harary, 1983); the level of trust among associates (LTR), consisting of the normative, calculated, and cognitive dimensions of organizational trust (Luna and Velasco, 2005). The implementation of cooperative principles (ICP), measured in relation to the appropriation of the seven principles of the International Cooperative Alliance (ACI, 1995), such as voluntary membership, democratic management, economic participation, autonomy and independence, training, inter-organizational cooperation, and commitment to the community.
Management and administrative structure (MAS), which considered the existence of a strategic plan, the assignment of positions, distribution of functions, internal regulations, management and accounting reports (Mazariegos-Sánchez et al., 2014), and women’s participation in management positions and the accountability and transparency system (ACT), which evaluated the existence and operation of internal accountability mechanisms according to minimum transparency parameters (Mazariegos-Sánchez et al., 2014).
Likewise, the following indicators were included: support requesting capacity (SRC), which assessed the organizational capacity to apply for financial support (Barrera-Rodríguez et al., 2016) through the formulation and application of productive projects to public and private entities; benefits for associates (BAS), which reflected perceptions of income, environment, quality of life and progress (FNC, 2019); the linkage with other institutional actors (LIA), also measured through network analysis in UCINET; innovation adoption (INA), defined as the number of innovations adopted per producer out of the total possible (Muñoz et al., 2007; Pérez et al., 2016) in areas such as production, marketing, environment, projects and participation (FNC, 2019); finally, the participation of associates (PAS), which collected information on economic contributions, volunteer work, administrative support, and donations.
Each indicator was evaluated using scales adapted to the context: ordinal scales from 1 to 100 for DDE, LIA and INA; from 1 to 10 for LTR; and three or four-level Likert-type scales for ICP, MAS, ACT, SRC, BAS and PAS. This combination enabled us to capture both objective aspects and subjective perceptions of the leaders surveyed. In total, 38 surveys were administered: eight (8) in ASOMEDACS, fifteen (15) in FCC and fifteen (15) in ASPROSI, under a non-probabilistic directed sampling (Aguilar et al., 2007), focused on leaders with extensive experience and legitimacy within their organizations.
Based on the field data obtained, the averages corresponding to each of the ten indicators were calculated by organization. Using these values and relative weighting based on expert judgment (Nardo et al., 2005; Saaty and Vargas, 2012), a weighted composite associativity index was developed. The weighting was defined based on the independent scoring provided by two researchers and five key informants with institutional experience in the coffee-growing sector of Cauca. The resulting weights were obtained by averaging these scores and incorporated into the final index calculation, thereby ensuring content validity, conceptual coherence, and contextual relevance for characterizing organizational behavior in rural environments. The subsequent statistical analysis was conducted using IBM SPSS Statistics v.26, employed for the calculation of descriptive statistics, the application of inferential tests (one-factor Anova and post-hoc tests with Tukey’s HSD) and the creation of the bar chart with 95% confidence intervals for the comparison of the means of the associativity index between the organizations.
This section presents and analyzes the results obtained from the calculation of the associativity index for three coffee growers’ organizations in the Cauca Department. The findings are organized into two subsections: the first analyzes the behavior of the indicators and their weights in each case study and the second compares the global indices through statistical tests.
To average the values obtained from the Likert-type scales in the ICP, MAS, ACT, SRC, BAS and PAS indicators, it was necessary to previously verify compliance with certain assumptions. To verify that the items of each indicator measured the same construct, Cronbach’s Alpha was estimated. The coefficients obtained (0.58-0.72) were within the acceptable ranges for short scales in social sciences (Cortina, 1993), supporting the use of the average as an aggregate measure of these ordinal indicators.
For the quantitative indicators (DDE, LTR, LIA and INA), the corresponding averages were calculated for each organization based on the values obtained in the field. Consequently, Table 1 presents the differentiated results of the associativity index by organization. It is evident that the ASPROSI organization obtained the highest value (76.41), followed by FCC (70.96) and ASOMEDACS (68.74).
The results show that associativity in the organizations analyzed is expressed differently, depending on the weight acquired by the organizational, relational and technical dimensions. The greater relevance given to the indicators benefits for associates (BAS), support request capacity (SRC), management and administrative structure (MAS) and level of trust among associates (LTR), suggests that, in the context of coffee growing in Cauca, collective action is strengthened when the organization manages to translate cooperation into concrete benefits and internal management capacities.
In the case of BAS, the results show that the elements that contribute most to organizational performance are associated with increased quality of life of the community and improvements in the environment. These benefits reinforce associates’ permanence in the organization and strengthen the sense of belonging by evidencing collective impacts that extend beyond individual economic income. With respect to SRC, two central actions stand out: active project management by associates and managers and linkage with external institutions to formulate and finance productive initiatives.
This result indicates that organizations with higher levels of associativity not only have access to resources but also develop organizational capacities to interact strategically with the institutional environment. In MAS, the elements that make a difference are concentrated in the preparation of activity reports, accounting and financial management, and women’s participation in administrative and managerial positions. These components reflect internal governance practices that strengthen transparency, decision-making and organizational sustainability.
In LTR, it is mainly driven by leaders’ capacities and competencies, the shared cultural, functional or territorial identity and personal relationships based on closeness, reciprocity and bonds of friendship or kinship. These factors show that organizational trust is built both from formal norms and from relationships that cohere the associative base. These findings coincide with studies that highlight the importance of organizational and administrative aspects in associative performance (Barrera-Rodríguez et al., 2016; Santana and León-Serrano, 2021) and are articulated with approaches that highlight the role of trust, social capital, and internal cohesion in collective dynamics (Espinoza and Gómez, 2018; González-Vásquez, 2018; Fonseca-Carreño et al., 2020).
At the same time, differences relative to studies that prioritize technical-productive variables, such as yield or infrastructure (Barrera-Rodríguez et al., 2016; Araujo et al., 2021; Benavides et al., 2021), can be interpreted in light of the territorial conditions and the level of organizational consolidation of the associations studied. In this sense, the lower relative weight of indicators linked to innovation adoption (INA) and the linkage with external institutional actors (LIA) does not necessarily reflect organizational weaknesses, but rather the structural constraints faced by small-scale organizations to access networks, resources and innovation processes, which reinforces the centrality of organizational and relational processes in the construction of associativity.
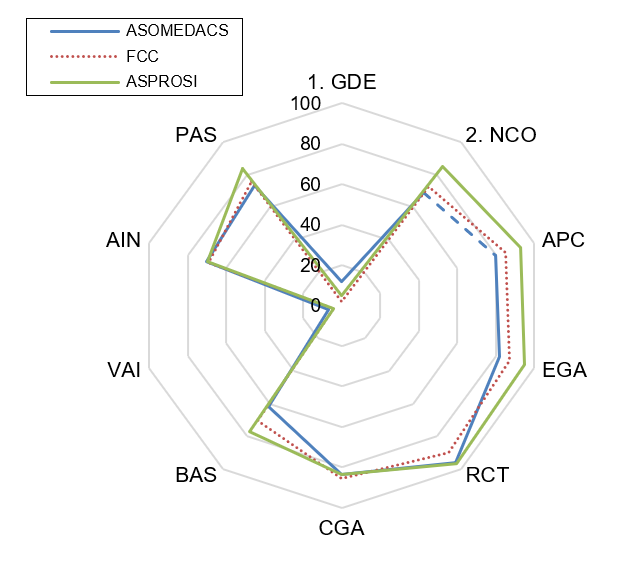
In addition, Figure 1 presents a multi-criteria radial graph that synthesizes the relative behavior of the three organizations in the ten indicators analyzed. This visualization made it possible to compare the associativity indices by organization based on values expressed as a percentage of the maximum value of each indicator, according to their original scale, and reinforces the comprehensive reading of the results presented in Table 1.
The results in Figure 1 show that ASPROSI has consolidated a more robust organizational model, with better performance in key indicators such as LTR, ICP, MAS, ACT, BAS and PAS. In contrast, the similarity between FCC and ASOMEDACS suggests common challenges in governance, the strengthening of the associative base and innovation, which limit their ability to activate territorial resources.
In order to determine whether the differences observed in the associativity index among the three organizations were statistically significant, a one-factor Anova was conducted. The quantitative variable was the associativity index and the qualitative variable corresponded to the three organizations. It was proposed as a null hypothesis (Ho) that there are no significant differences between the associativity index of the three organizations, and as an alternative hypothesis (Ha) that there are significant differences in the associativity index in at least one organization.
Before applying the Anova, compliance with the statistical assumptions of normality and homogeneity of variances was verified. The assumption of data normality was evaluated by the Shapiro-Wilk test, adequate for small sample sizes (n < 50) (Shapiro & Wilk, 1965), whose results indicated significance values greater than 0.05 in the three groups (ASOMEDACS: ρ= 0.237; FCC: ρ= 0.102; ASPROSI: ρ= 0.312), which allowed the assumption of normality to be accepted. Likewise, the Levene test for homogeneity of variances was not significant (ρ= 0.023), which allows the use of parametric tests such as Anova and post-hoc multiple comparison tests.
In all cases, a statistical significance level of α= 0.05 was assumed. The descriptive statistical results presented in Table 2 show that ASPROSI had the highest average value of the associativity index (76.41), followed by FCC (70.96) and ASOMEDACS (68.74). Standard deviations also varied between groups, which evidences different levels of internal dispersion in responses and justifies applying additional tests to assess the significance of these differences.
The result of the Anova showed a significance value of ρ= 0.004, which is lower than the threshold of α= 0.05, so the null hypothesis was rejected and the alternative hypothesis was accepted. To accurately identify which pairs of organizations showed these differences, Tukey’s HSD test was applied. This test revealed significant differences between ASPROSI and ASOMEDACS (ρ= 0.007) and between ASPROSI and FCC (ρ= 0.024), whereas no significant differences were observed between ASOMEDACS and FCC (ρ= 0.62).
This trend was reaffirmed by the identification of homogeneous subsets, which grouped ASOMEDACS and FCC in the same set, differentiating them from ASPROSI, which had a statistically higher meaning (Figure 2). The classification of the means by superscript letters supports this result: ASOMEDACS (68.74a ± 4.59) belongs to a group different from that of ASPROSI (76.41b ±5.25), whereas FCC (70.96ab ±5.91) occupied an intermediate position, with no significant differences with both extremes.
Finally, the results allowed us to infer that a higher index of associativity is related to a greater capacity to generate collective action, a necessary condition for effectively mobilizing the resources available in the territory.
Beyond its comparative value, the associativity index provides elements to understand the internal dynamics of organizations by articulating organizational, relational and technical dimensions that reflect concrete practices of governance, trust and participation. Its usefulness lies in identifying which components strengthen collective action and in offering an analytical basis to guide organizational strengthening processes, especially in small-scale rural contexts. This approach is particularly relevant in rural territories where small-scale producers predominate and collective action is a key way to strengthen Localized Agrifood Systems and promote rural development with a territorial approach.
In this sense, it is recommended to extend the application of the index to other sectors and territories and to integrate it with economic, environmental and political performance indicators in order to provide inputs to the formulation of public policies and organizational strategies in rural areas. As a future line of research, it was proposed to analyze how the associativity index affects the capacity of small-scale coffee growers’ organizations to activate territorial resources within a localized agrifood system (LASY).
We are grateful to the coffee growers and directors of ASOMEDACS, FCC and ASPROSI in the Cauca Department of Colombia. Likewise, we also thank the research fund of the WWB Colombia Foundation for financing the fieldwork.
Espinoza-Lastra, Ó. R. y Gómez- López, J. D. 2018. índice de capacidades asociativas: construcción teórica y propuesta metodológica de cálculo para organizaciones de economía solidaria. CIRIEC-España. Revista de Economía Publica, Social y Cooperativa. 94:285-316. https://doi.org/10.7203/CIRIEC-E.94.10663.
FNC. 2019. Federación Nacional de Cafeteros de Colombia. Diagnóstico de la asociatividad en el sector cafetero colombiano. In: dirección de investigaciones económicas. Ensayos Sobre Economía Cafetera. 33(1):9-36. https://federaciondecafeteros.org/app/uploads/2020/05/EconomíaCafeteraNo33Webmayo30.pdf.
Nardo, M.; Saisana, M.; Saltelli, A.; Tarantola, S.; Hoffman, A. and Giovannini, E. 2005. Handbook on constructing composite indicators. In: OECD Statistics Working Papers (03):21-23. http://www.oecd-ilibrary.org/docserver/download/5lgmz9dkcdg4.pdf?expires=1471336777&id=id&accname=guest&checksum=158391DADFA324416BB9015F3E4109AF.