elocation-id: e4000
Alternaria on sweet granadilla is a foliar disease caused by a saprophytic fungus that poses a significant threat as it reduces the photosynthetic area and consequently affects the quality of the fruit. Nevertheless, there is no instrument available to facilitate the estimation of leaf severity in the field. In view of this, the objective of this research was to design and validate a diagrammatic scale that allows assessing the severity of Alternaria sp. on sweet granadilla (Passiflora ligularis Juss.) leaves. A diagrammatic scale was developed based on an inspection of 124 leaves. The proposal included seven levels of foliar severity (0%, 1%, 2%, 4%, 8%, 16% and 28%), established according to the Weber-Fechner Law. For validation, ten evaluators recorded the severity on 60 leaves first without using the scale, and then seven days later, using it. The results projected an average coefficient of determination (R2) of 0.639 in the first evaluation and 0.88 when applying the proposed scale. In addition, absolute errors decreased. In conclusion, this tool proved to be accurate and reproducible for quantifying the severity of Alternaria sp. on sweet granadilla leaves.
Alternaria sp., foliar disease, linear regression, plant health, severity estimation.
Sweet granadilla is the fruit of Passiflora ligularis (Juss.), which is consumed nationally (Peru). In fact, the cultivation of sweet granadilla is a key activity for the economic development of the districts of Oxapampa, Huancabamba, and Chontabamba, in the department of Pasco, Peru (Romero et al., 2020). However, its production can be severely limited due to the emergence of fungal pests (Sampaio et al., 2002). The main ones associated with its cultivation are: Alternaria, Cladosporium, Anthracnose, Botrytis and Fusarium (Acosta-Trinidad et al., 2021). Of these, the incidence of Alternaria on the leaves stood out because it reduces photosynthetic area, which negatively affects fruit development. Its symptoms begin with circular spots with a brown center, and as the disease progresses, they sink and acquire a light brown hue (Chen et al., 2023).
Foliar lesions affect yield and leaf health (García-Lozano et al., 2007). In addition, this type of condition causes significant losses in fruit quality and foliar vigor (Tamayo et al., 2000). Estimating the severity of Alternaria in sweet granadilla plantations is usually important for planning management strategies but is imprecise due to the lack of tools to guide evaluators during assessment.
In this context, a scale is a valuable, adequate, and reliable tool to visually estimate the severity of a leaf fungus (Rojas-Chacón et al., 2024). Likewise, users can accurately approximate the actual severity (Figueiredo et al., 2022). In short, a scale used to estimate foliar damage is accurate and precise and presents reproducible results (Patricio-Hernández et al., 2022). Nonetheless, no scales have been published to estimate the severity of Alternaria on sweet granadilla leaves. Given the identified problem, this research aimed to design and validate a diagrammatic scale that allows evaluating the severity of Alternaria sp. on sweet granadilla (P. ligularis) leaves, thereby making visual lesion estimation more accurate and optimizing phytosanitary monitoring processes.
The morphological characterization of Alternaria was carried out at the Phytopathology Laboratory of the Daniel Alcides Carrión National University, Oxapampa campus; likewise, at that headquarters (Oxapampa, Pasco, Peru) in 2025, the Alternaria severity diagrammatic scale was developed and evaluated.
The morphological characterization was conducted based on Colombian sweet granadilla leaves with symptoms of Alternaria (leaves with irregularly shaped brown spots with yellowish halos); these samples were incubated in a wet chamber for two days to induce the sporulation of the fungus; then, the rapid mounting technique was used to observe conidia and conidiophores on slides with a Helmut Hund GmbH binocular microscope, and microphotographs of both structures were obtained; finally, the images and characteristics observed were contrasted with those described by Woudenberg et al. (2014) to confirm the presence of Alternaria.
One hundred twenty-four leaves of sweet granadilla (P. ligularis) with different degrees of spot by Alternaria were collected (May 2025) from a plot and scanned to quantify the leaf area and the affected area using the ImageJ software, which allowed us to estimate the percentage of severity by leaf; based on the minimum and maximum values observed and applying the Weber-Fechner Law of Visual Acuity, seven perceptible levels of severity were defined (Ruiz et al., 2021), for which a representative diagrammatic scale was developed in Microsoft Publisher 2019.
Ten evaluators (agronomy students of the IX semester) estimated the severity of Alternaria in 60 images of sweet granadilla leaves (0.1% to 27.9% of affected area) randomly projected for 30 s in PowerPoint 2019 (Lavilla et al., 2021), after an initial session without diagrammatic scale support and after seven days (Belan et al., 2014; Freitas et al., 2015), the evaluation was repeated using the printed scale, recording in both cases their estimates in a standardized format and comparing the results with the actual values using linear regression (Acosta and Acosta, 2025) and Student’s t-test (p < 0.05) to validate the accuracy and benefit of the scale.
To statistically validate the diagrammatic scale of Alternaria severity on sweet granadilla leaves, the evaluators’ visual estimates were compared with the actual values of affected area by linear regression, considering the actual severity as an independent variable and the estimate as dependent variable; accuracy was evaluated by testing whether the angular coefficient (B1) differed significantly from 1 and the intercept (B0) from 0 using Student’s t-test (H0: B1= 1, B0= 0 vs H1: B1 ≠1, B0 ≠ 0; α= 0.05) (Acosta and Acosta, 2025). For its part, precision was quantified by the coefficient of determination (R2) of each regression and by the variance of absolute errors (estimate-actual) (Belan et al., 2014; Freitas et al., 2015); all analyses were performed in Jamovi 2.6.23 to determine the improvement in accuracy and precision provided by the diagrammatic scale.
The results of the microscopic observations of the fungus revealed the presence of elongated, unbranched conidiophores and septate conidia; consequently, the observed foliar symptomatology was consistent with infections caused by the fungus of the genus Alternaria (Figure 1).
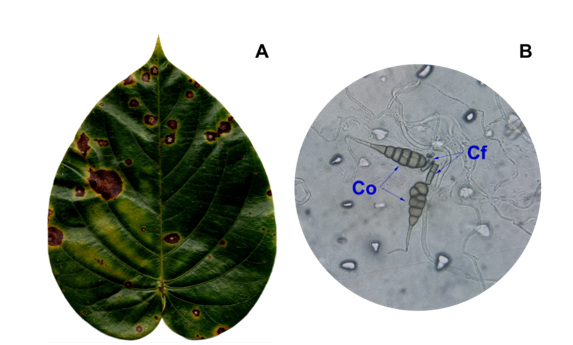
The results are similar to those reported by Woudenberg et al. (2014), who also report that the morphology of Alternaria conidia is a key morphological structure for identifying this genus. Similarly, Hoyos and Castillo (2015) identified conidia with similar characteristics in sweet grenadilla leaves with brown spots and they attributed them to the genus Alternaria.
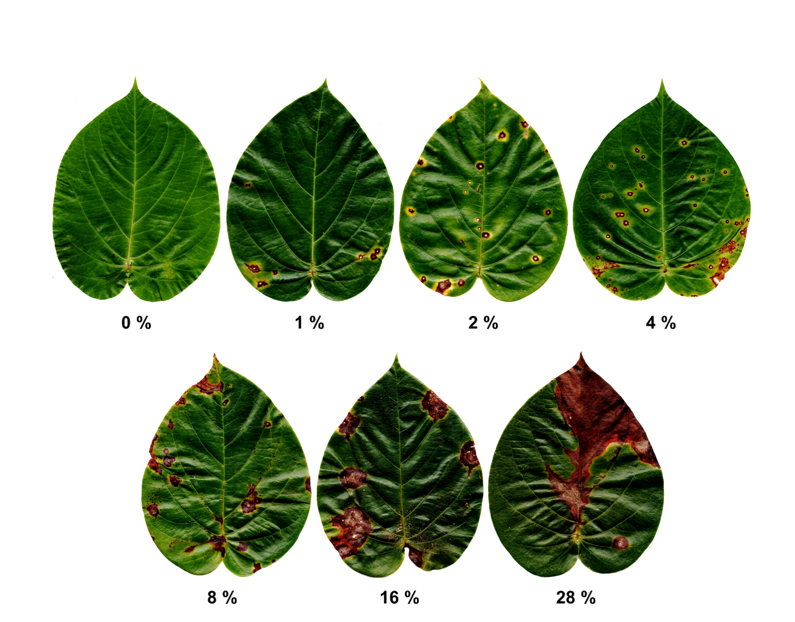
The natural severity, evaluated on 124 adult leaves, ranged from 0% to 28.3%. Based on the Weber-Fechner Law of Visual Acuity, seven levels of severity were defined: 0%, 1%, 2%, 4%, 8%, 16% and 28% (Figure 2).
The accuracy of the assessments changed markedly when comparing results without and with the use of the designed scale. Without the scale, the R2 values ranged from 0.4 to 0.844, with an average of 0.639; nevertheless, with the scale, these values increased to 0.836 to 0.923, with a mean of 0.88, reflecting clearly more accurate estimates (Table 1).
A similar result was reported by Freitas et al. (2015), who mentioned that using a scale to evaluate a disease yields more precise and accurate results than not using it. Salgado et al. (2009) showed that using a scale allowed evaluators to significantly improve their accuracy, with coefficients of determination ranging from 0.85 to 0.9.
In short, the scale steadily increases the precision of the estimates, which confirms its effectiveness in standardizing and reinforcing visual reliability. In the linear regression analysis, the intercept of 50% of the evaluators (I, II, V, VII and X) differed significantly from zero without the use of the scale; in contrast, when using it, only 30% (II, IV and VI) showed this difference; in all cases, they were overestimates (Table 1).
Regarding the angular coefficient of the line, 100% of the evaluators presented values other than 1, both without and with the diagrammatic scale; however, the proportion of evaluators who overestimated their results decreased from 70% (I, II, III, IV, V, VI and IX) without the scale to 20% (VI and VII) when using it (Table 1). Fragoso-Benhumea et al. (2022) reported that, without a scale, 5% differed significantly in intercept (0.254) and angular coefficient (0.94); with a scale, 100% overestimated the intercept (mean 0.112) and underestimated the coefficient (mean 0.96).
In addition, López-Reyes et al. (2024) found that, when not using a scale, 25% of the evaluators presented an intercept significantly different from zero (mean of 0.855), and when using it, 100% showed overestimations (mean of 0.354); similarly, without a scale, 25% differed in the angular coefficient (mean of 0.924), whereas with a scale, 100% showed underestimates (mean < 0.0001). In this same context, Klosowski et al. (2013) recorded significantly nonzero intercept values (p-value ≤ 0.05) in 50% of evaluators when no scale was used and in 38% when a scale was used.
Likewise, Perina et al. (2019) reported that, by using linear regression analysis, a diagrammatic scale yielded estimates with greater accuracy, precision, repeatability and reproducibility. The results suggest that the scale standardizes responses, thereby reducing variability and attenuating the bias of estimation errors. Pairwise comparisons of the evaluators’ estimates, without a diagrammatic scale, resulted in R2 values ranging from 0.178 to 0.777, with an average of 0.511 (Table 2). Using the proposed diagrammatic scale, the range of R2 increased to 0.739-0.932, with a mean of 0.858 (Table 2).
For the latter, 88.88% of cross-correlations between evaluators exceeded an R2 of 0.8, which confirms the high reproducibility of the estimates when using the seven-level severity diagrammatic scale. These results are consistent with those reported by Braga et al. (2020), who assessed inter-evaluator reliability using pairwise correlations: without a scale, the coefficients of determination were 0.43 and 0.97; with a scale, they increased to 0.84 and 0.99, reflecting a notably stronger relationship.
Likewise, Ortega-Acosta et al. (2016) reported that, without a scale, the values of the coefficient of determination (R2) varied between 0.39 and 0.86, with an average of 0.69; when using a scale, the values increased to a range of 0.81 to 0.95, with a mean of 0.87, and in 100% of the combinations between evaluators, R2 values greater than 0.8 were obtained. In summary, the use of a diagrammatic scale significantly improves reliability among evaluators, raising R2 values above 0.7 in most comparisons, as confirmed by both the results obtained and the previous findings.
In addition, the accuracy of the proposed diagrammatic scale was assessed by calculating absolute errors (the difference between the visual estimate of damage and the actual damage); as a result, the random distribution of residual errors around the prediction line reflects an improved fit of the model (Figure 3). When not using the scale, residuals ranged from -16.7% to 52.8%; when using it, this range was reduced to -13.9% and 16% in the average estimate (Figure 3).
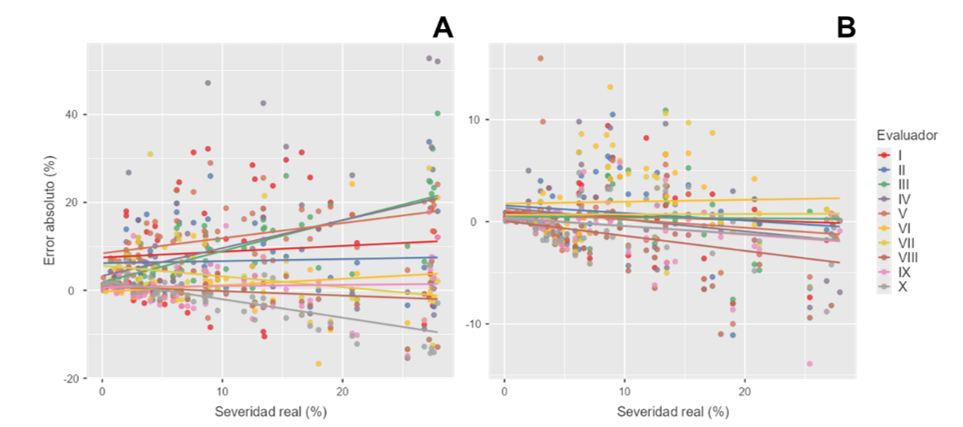
Similarly, Dolinski et al. (2017) reported that using a scale reduces absolute error in most estimates within ±10% compared to errors of +54% and -16% without a scale. A similar result was reported by de Farias et al. (2025). Vieira et al. (2014) demonstrated that employing a diagrammatic scale improves model fit by promoting a random distribution of residual errors around the prediction line.
In summary, the use of a diagrammatic scale improves the fit of the model and significantly reduces absolute errors in visual estimates of leaf damage (substantially narrowing its range of variation).
The seven-level diagrammatic scale designed to estimate the severity of Alternaria sp. on sweet granadilla leaves was shown to significantly increase the accuracy and reproducibility of the assessments. Its application increases R2 values, reduces both the inter-evaluator variability and the magnitude of residual errors, and decreases overestimation tendencies. These results confirm that the methodology offers accurate and consistent estimates among different evaluators. Therefore, the proposed scale is an effective and reliable tool for efficiently monitoring this disease.
Acosta-Trinidad, L. T.; Azania-Fabian, D. K. and Azania-Fabian, R. 2021. Cultivo dual in vitro de cepas nativas de Trichoderma spp. frente a Botrytis sp. patógeno de Passiflora ligularis Juss. Revista de Investigación Agropecuaria Science and Biotechnology. 1(4):43-55. https://doi.org/10.25127/riagrop.20214.720.
Braga, K.; Fantin, L. H.; Roy, J. M. T.; Canteri, M. G. and Paiva-Custódio, A. A. 2020. Development and validation of a diagrammatic scale for the assessment of the severity of bacterial leaf streak of corn. European Journal of Plant Pathology. 157(2):367-375. https://doi.org/10.1007/s10658-020-02008-7.
Farias-Andrade, I. L.; Amaral, A. G. G.; Martins, R. B.; Camara-Correia, K.; Silveira Duarte, H. S.; Rocha-Silva, H.; Saraiva-Camara, M. P. and Michereff, S. J. 2025. Development and validation of a standard area diagram set for assessment of target leaf spot severity on Handroanthus serratifolius. Journal of Phytopathology. 173(3):e70105. https://doi.org/10.1111/jph.70105.
Figueiredo, Y. F.; Oliveira, J. M.; Almeida, K. A.; Pereira, P. d. F.; Pedroso, L. A.; Guimaraes, M. d. R. F.; Costa, M. M. and Pozza, E. A. 2022. Coffee leaf rust assessment: comparison and validation of diagrammatic scales for Coffea arabica. European Journal of Plant Pathology. 164(3):411-427. https://doi.org/10.1007/s10658-022-02570-2.
Fragoso-Benhumea, J. M.; Sánchez-Pale, J. R.; Castañeda-Vildózola, Á.; Franco-Mora, O.; Gutiérrez-Ibáñez, A. T.; Contreras-Rendón, A. and García-Velasco, R. 2022. Diagrammatic scale for rust severity assessment in broad bean (Vicia faba). Revista Mexicana de Fitopatología. 40(3):474-482. http://dx.doi.org/10.18781/R.MEX.FIT.2206-2.
Hoyos Carvajal, L. M. y Castillo Corredor, S. Y. 2015. Enfermedades en granadilla (Passiflora ligularis Juss.). En L. M. Melgarejo Ed. Granadilla (Passiflora ligularis Juss.): caracterización ecofisiológica del cultivo. Universidad Nacional de Colombia. 153-176 pp. https://repositorio.unal.edu.co/handle/unal/84150.
López-Reyes, E. A.; Castañeda-Vildózola, A.; Sánchez-Pale, J. R.; Contreras-Rendón, A.; Fragoso-Benhumea, J. M.; García-Velasco, R. 2024. Escala diagramática para cuantificar la severidad de mancha café en el cultivo de haba. Revista Mexicana de Fitopatología. 42(1):1-8. https://doi.org/10.18781/R.MEX.FIT.2209-4.
Ortega-Acosta, S. A.; Velasco-Cruz, C.; Hernández-Morales, J.; Ochoa-Martínez, D. L.; Hernández-Ruiz, J. 2016. Diagrammatic logarithmic scales for assess the severity of spotted leaves and calyces of roselle. Revista Mexicana de Fitopatología. 34(3):270-285. http://dx.doi.org/10.18781/R.MEX.FIT.1606-6.
Rojas-Chacón, J. A.; Echeverría-Beirute, F.; Till, B. J. and Gatica-Arias, A. 2024. Assessment of Hemileia vastatrix resistance in chemically mutagenized Coffea arabica L. leaf discs and the emergence of a novel resistance scale. Journal of Plant Pathology. 106(3):1093-1106. https://doi.org/10.1007/s42161-024-01620-4.
Romero-Simón, E. M.; Canto-Saenz, M.; Jiménez-Dávalos, J. E.; Blas-Sevillano, R.; Vargas-Winstanley, S. E. y Julca-Otiniano, A. 2020. Sostenibilidad social de un sistema productivo familiar con granadilla (Passiflora Ligularis Juss.) en la provincia de Oxapampa, Pasco-Perú. Agricultura, Sociedad y Desarrollo. 17(2):217-232. https://doi.org/10.22231/asyd.v17i2.1343.
Sampaio-Carneiro, M.; Aranha-Camargo, L. E.; Guedes-Coelho, A. S.; Vencovsky, R.; Rui, P. L. J.; Colauto-Stenzel, N. M. and Carneiro-Vieira, M. L. 2002. RAPD-based genetic linkage maps of yellow passion fruit (Passiflora edulis Sims. f. flavicarpa Deg.). Genome. 45(4):670-8. https://doi.org/10.1139/g02-035.