elocation-id: elocation-id: e4267
This research evaluated the fruit characteristics of three strawberry (Fragaria × ananassa Duch.) varieties (Fronteras, San Andreas and Víctor) grown under greenhouse conditions and under the same agronomic management. The experiment was established in March 2025 at the Northeast Interdisciplinary Center of the University of Guanajuato, located in the municipality of Tierra Blanca, Guanajuato, under a completely randomized experimental design. The following variables were measured: polar diameter, major equatorial diameter, fresh fruit weight, and total soluble solids content (°Brix). Data were analyzed using a multivariate approach, applying a transformation based on the squared Euclidean norm to integrate the variables into a single index, which was then subjected to analysis of variance (Anova) and comparison of means using Tukey’s test (p≤ 0.05). The analysis of variance showed significant differences between varieties (p= 0.003); Tukey’s test showed that Víctor and Fronteras did not differ from each other and according to the polar and equatorial diameters and the weight of the fruit, they presented the best overall performance, compared with San Andreas, which was significantly lower. It is concluded that, under greenhouse conditions and the climate of northeastern Guanajuato, the Víctor and Fronteras varieties exhibited better overall performance than San Andreas in fruit quality.
analysis of variance, fruit quality, total soluble solids.
In agricultural production, the choice of crop variety directly influences production costs and phytosanitary management (Hancock, 2020). According to Aguilar-García et al. (2021), in strawberry crops, the responses of cultivars under the same agronomic management vary significantly, generating uncertainty for producers when defining the plant material to establish under protected conditions.
It has been observed that certain cultivars show greater efficiency in biomass accumulation and commercial fruit production, whereas others show more variable responses or lower yields per unit area (Alvarado-Chavez et al., 2020; Mixquititla-Casbis et al., 2020).
Varietal differences influence strawberry fruit quality under protected cultivation conditions, affecting characteristics such as total soluble solids, firmness and size, thereby impacting commercial value and shelf life (Skrovankova et al., 2015). Taste, determined by sugar and acid contents (Azodanlou et al., 2003; Ulrich-Detlef and Olbricht-Klaus, 2013), color and firmness are key to consumer acceptance. In addition, environmental factors such as temperature and light intensity, derived from different cultivation techniques, can modify these quality attributes (Hoppula, 2006).
The findings of Palencia et al. (2016); Ariza et al. (2021); Macías-Gallardo et al. (2023) indicate that some cultivars combine high yields with good organoleptic quality, whereas others prioritize one of these attributes to the detriment of the other. This reinforces the need for local varietal evaluations for intensive production systems.
The plot’s geographic location is relevant because latitude influences temperature and day length, factors that affect plant performance (Krüger et al., 2012). In addition, there is a strong interaction between temperature and photoperiod that determines the transition from vegetative to floral meristem in single-fruiting or June-bearing cultivars (Bradford et al., 2010; Hancock, 2020), with considerable variation in cultivar response to both factors for floral induction (Sønsteby and Heide, 2009; Heide et al., 2013; Choi et al., 2015).
In this context, three commercial varieties with different productive and physiological behavior were selected to evaluate their response in northeastern Guanajuato under greenhouse conditions. The San Andreas variety shows medium to high vigor, low runner emission, and good performance in protected cultivation systems (Miranda et al., 2024). Fronteras is a short-day variety with large, firm fruits and high yields (Shaw and Larson, 2014). The Victor variety, also a short-day variety, adapts favorably to autumn production systems and requires at least 200 h cold (SKnapp et al., 2021).
This work aimed to evaluate the agronomic response of three strawberry varieties, San Andreas, Víctor and Fronteras, grown under greenhouse conditions with the same agronomic management and with the climatic conditions of northeastern Guanajuato. The results generated seek to provide a scientific basis that allows producers in the region to select the most suitable variety for their production environment.
The study was conducted in the municipality of Tierra Blanca, Guanajuato, at the facilities of the Northeast Interdisciplinary Center of the University of Guanajuato (CINUG, by its Spanish acronym), located at the geographical coordinates 21° 5’ 10.19” north latitude and 100° 11’ 20.76” west longitude.
The location of the experimental plot presents a BSk climate (temperate semiarid) according to the Köppen classification (Kottek et al., 2006). During the experimental period, climatic conditions were characterized by an average temperature ranging from 13.6 °C to 21.2 °C. The average number of daylight hours was 12.2.
To conduct the experiment, root-balled seedlings of three strawberry varieties San Andreas, Fronteras and Víctor were used. The crop was established in March 2025. Drip irrigation was implemented using irrigation tape with a flow rate of 1 L h-1, with double tape in each bed, under a greenhouse system and with homogeneous agronomic production and management, in order to reduce variability not attributable to the study factor (variety) and to ensure comparability of the results.
Fertilization was applied twice weekly. The nutrient solution was prepared following the universal method proposed by Steiner (1961), using electrical conductivity levels of 0.5, 1, 1.3 and 1.5 for the vegetative stages of initiation, flowering, fruiting and full fruiting, respectively.
A completely randomized experimental design (CRED) was used, with strawberry variety as the study factor. The experimental unit was a cultivation bed measuring 5 m in length and 0.6 m in width, established with 30 plants, because the treatment (variety) was applied at this level.
Each treatment was evaluated with five replications, equivalent to five experimental units per variety. Varieties were randomly assigned using the agricolae package (De Mendiburu, 2023) in R (R Core Team, 2024).
A total of 12 plants were randomly selected within each experimental unit and five fruits were collected per plant, obtaining a total of 30 fruits per experimental unit. The selected fruits were healthy, with no mechanical damage or visible deformations.
The harvest was carried out when the fruits reached a uniform state of commercial ripeness, defined by the presence of at least 75% red coloration on the surface, a criterion widely used for strawberries due to its relationship with organoleptic quality and market acceptance (Corvino et al., 2023), where appearance is the quality attribute that most influences price formation (Chitarra, 2005).
The individual observations obtained from the fruits were averaged for each variable evaluated within each experimental unit (bed). These averages were used as a basis for statistical analysis.
Four quantitative variables related to the fruit’s dimensions, weight and quality were recorded: polar diameter (cm), length of the fruit from the base to the apex, measured with a precision digital vernier (±0.01 cm); major equatorial diameter (cm), the maximum transverse measurement of the fruit; fresh weight (g), the total mass of the fruit determined with a digital scale (±0.01 g); and total soluble solids (TSS, %), measured with a digital refractometer and expressed in °Brix.
The data were analyzed considering multiple response variables associated with fruit quality. Given the multivariate nature of the data and in order to avoid increasing type I error from the use of multiple independent univariate tests, no individual analyses were performed for each variable (Al-Abdullatif et al., 2019).
Instead, the method proposed by Herrera-Reyes et al. (2024) was used, which allows analyzing multiple response variables in a completely randomized experimental design (CRED). In this approach, each experimental unit is represented by a vector of response variables defined as:
Where I represents treatment; j represents replication and k= 1, 2, …, p denotes each of the variables evaluated. Thus, Yij corresponds to the vector of observations of the experimental unit associated with the i-th treatment in the j-th replication.
This vector is transformed into a scalar variable by the squared Euclidean norm, defined as:
This transformation allows the multivariate problem to be reduced to a univariate one, integrating the joint information of all variables into a single magnitude. Since Xij is a sum of random variables, under general conditions, it can be approximated to a normal distribution by asymptotic results, which allows its analysis using conventional univariate techniques.
Independence among observations is maintained at the level of the experimental unit because of the design’s randomization process, which allows the analysis of variance to be applied to the transformed variable.
The transformed values Xij were analyzed through an analysis of variance (Anova) under a completely randomized design. A significant difference was detected among treatments (varieties), so the means were compared using Tukey’s test (p≤ 0.05).
Before the inferential analysis, an exploratory analysis of the data was performed, including the calculation of descriptive statistics (mean and standard deviation) by variety. The assumptions of residual normality and homogeneity of variances were verified using the Shapiro-Wilk and Levene tests, respectively. Additionally, diagnostic graphs of the model were used.
All analyses were performed in R version 4.4.1 (R Core Team, 2024), employing base functions for Anova and complementary packages for specific analyses, including agricolae for multiple comparisons and car for the homogeneity of variances test.
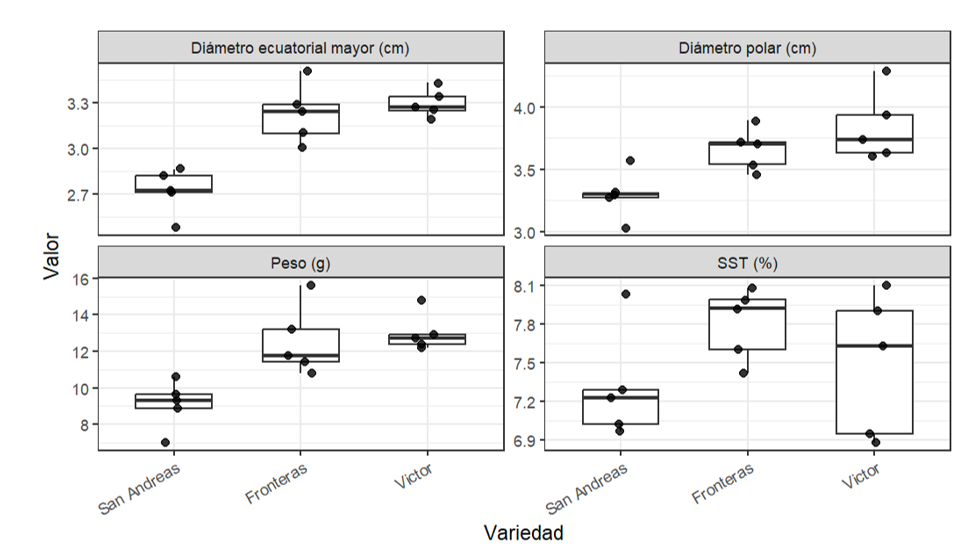
Table 1 presents the mean and standard deviation (SD) values of the variables evaluated in the three strawberry varieties. The Víctor variety stood out for having the highest values in the variables associated with fruit size and weight, followed by Fronteras, while San Andreas showed the lowest values. Chiomento et al. (2021) obtained similar data when evaluating different strawberry cultivars; in their study, the Fronteras variety had a higher fruit weight than San Andreas.
For the polar diameter, the Víctor variety exhibited the highest value (3.84 ±0.28 cm), followed by Fronteras (3.66 ±0.17 cm), while San Andreas presented the lowest value (3.30 ±0.19 cm). This same behavior was observed in the major equatorial diameter, where Víctor (3.3 ±0.09 cm) and Fronteras (3.23 ±0.19 cm) surpassed San Andreas (2.72 ±0.15 cm). Miranda et al. (2025) reported similar values for the San Andreas variety in the polar diameter, where a mean value of 3.3 cm was reached.
Regarding fruit weight, Víctor presented the highest average value (13 ±1.04 g), very close to that of Fronteras (12.56 ±1.92 g), whereas San Andreas showed a considerably lower value (9.09 ±1.33 g), indicating lower fruit development in this variety. Miranda et al. (2025) report similar values for the San Andreas variety and Simkova et al. (2023) do so for the Fronteras variety.
On the other hand, the total soluble solids (TSS) content did not follow the same pattern, since the Fronteras variety had the highest value (7.8 ±0.28%), followed by Víctor (7.49 ±0.55%) and San Andreas (7.31 ±0.43%), suggesting less pronounced differences in chemical attributes compared to physical variables. Minutti-López et al. (2019) reported similar values for the San Andreas variety.
The distribution of the variables evaluated by variety is presented in Figure 1, which illustrates the data’s variability and the general trend described above.
The transformed variable took values of 155.96 ±28.14 for San Andreas, 245.4 ±49.96 for Fronteras and 251.93 ±33.51 for Víctor. The distribution of this variable by variety is shown in Figure 2.
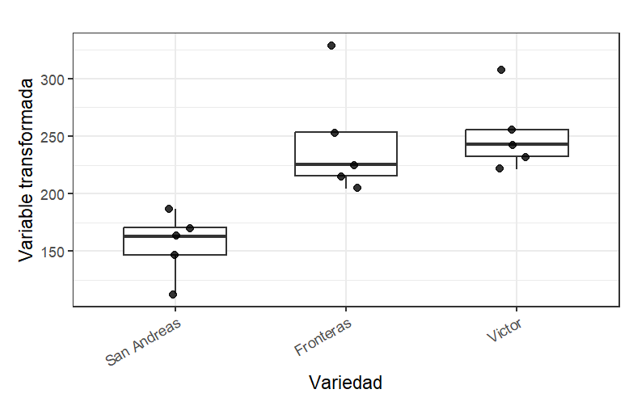
The analysis of variance applied to the transformed variable (Table 2) showed statistically significant differences among varieties (F= 9.78; p= 0.003), indicating that the overall behavior of the varieties, considering the set of variables evaluated, was not homogeneous.
| Source of variation | Degrees of freedom | Sum of squares | Mean squares | F | p-value |
|---|---|---|---|---|---|
| Variety | 2 | 28 755 | 14 378 | 9.78 | 0.003 |
| Error | 12 | 17 644 | 1 470 | - | - |
The significant effect of the variety factor suggests that at least one variety differs from the others in terms of the multivariate index. Likewise, the magnitude of the F-statistic reflects considerably greater variation between treatments than within the experimental units.
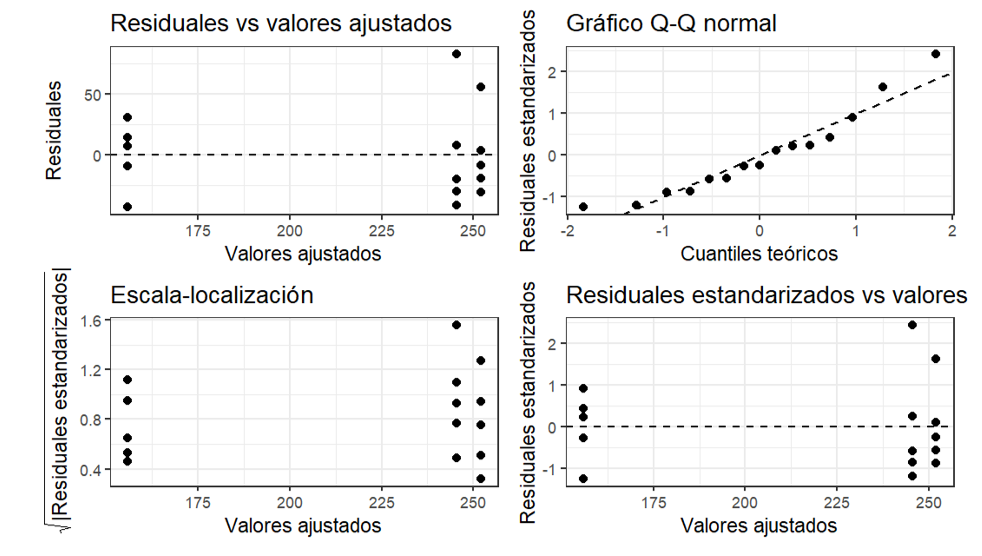
The verification of the model assumptions indicated that the residuals followed a normal distribution (Shapiro-Wilk, p= 0.1981) and that the variances were homogeneous (Levene, p= 0.7719), as supported by the model diagnostic graphs (Figure 3).
The multiple comparison of means using Tukey’s test (p≤ 0.05) (Table 3) showed that the Víctor and Fronteras varieties were in the same statistical group (a), with no significant differences between them, with average values of 251.93 and 245.4, respectively. By contrast, the San Andreas variety was in a different group (b) and had a significantly lower average value (155.96).
| Variety | Transformed variable | Group |
|---|---|---|
| Víctor | 251.93 | a |
| Fronteras | 245.4 | a |
| San Andreas | 155.96 | b |
These results indicate that, from a multivariate perspective, the Víctor and Fronteras varieties exhibit superior and comparable performance in relation to the set of variables evaluated, whereas San Andreas shows significantly lower performance.
The exploratory analysis revealed that the Víctor and Fronteras varieties stood out in fruit size and weight, while San Andreas showed the lowest values; however, total soluble solids showed little variation between varieties. Through a multivariate transformation that integrated all the variables in a single index, it was confirmed that Víctor and Fronteras do not differ significantly from each other and reach the highest quality values, in contrast to San Andreas, which registered significantly lower values.
It is concluded that, under greenhouse conditions in northeastern Guanajuato, the Víctor and Fronteras varieties stand out for their superior overall performance in fruit quality, compared to San Andreas, which shows a lower yield when considered together.
Alvarado-Chávez, J. A.; Gómez-Gonzáles, A.; Lara-Herrera, A.; Díaz-Pérez, J. C. y García-Herrera, E. J. 2020. Rendimiento y calidad de fruto de fresa cultivada en invernadero en sistema hidropónico piramidal. Revista Mexicana de Ciencias Agrícolas. 11(8):1737-1748. https://doi.org/10.29312/remexca.v11i8.2460.
Chiomento, J. L. T.; Lima-Júnior, E. P.; D’Agostini, M.; De Nardi, F. S.; Trentin, T. S.; Dornelles, A. G.; Huzar-Novakowiski, J. and Calvete, E. O. 2021. Horticultural potential of nine strawberry cultivars by greenhouse production in Brazil: a view through multivariate analysis. Scientia Horticulturae. 279:109738. https://doi.org/10.1016/j.scienta.2020.109738.
Macías-Gallardo, F.; Barajas-Díaz, C. G. M.; Mireles-Arriaga, A. I. and Ozuna, C. 2023. Strawberry variety influences the effectiveness of postharvest treatment with gaseous ozone: impact on the physicochemical, microbiological, and bioactive properties of the fruit. Processes. 11(2):346. https://doi.org/10.3390/pr11020346.
Minutti-López, S. P.; Gallardo-Velázquez, T.; Osorio-Revilla, G. and Meza-Márquez, O. G. 2019. Chemical composition and antioxidant capacity in strawberry cultivars (Fragaria x ananassa Duch.) by FT-MIR spectroscopy and chemometrics. CyTA-Journal of Food. 17(1):724-732. https://doi.org/10.1080/19476337.2019.1645211.
Miranda, P. S.; Lima, Z. C. M.; Pérez-Maluf, R.; Oliveira, E. P.; Monroe, P. H. M. and Moreira, A. A. 2025. Influence of pollination mechanisms on the physical-chemical quality of strawberry (Fragaria x ananassa) cv. San Andreas. Anais da Academia Brasileira de Ciências. 97(3):e20240799. https://doi.org/10.1590/0001-3765202520240799.