elocation-id: elocation-id: e4181
In the High Valleys, minimum daily temperatures <10 °C constrain high-value vegetable production, even in unheated greenhouses, because the thermal jump produced by the plastic cover is between 1 and 3 °C, a situation that affects small and medium-sized producers. As part of strategies to reduce their dependence on active heating systems, a conventional greenhouse and a semi-buried greenhouse (SG) (at -1.7 m) were built in the municipality of Morelos, State of Mexico, both measuring 96 m2. Temperature and relative humidity were measured every 10 min in the conventional greenhouse, the semi-buried greenhouse, and the open field from September 18 to December 17, 2025. The results showed that the semi-buried greenhouse, compared to the open field and the conventional greenhouse, significantly increased the minimum temperature by 4.42 °C and 3.35 °C, respectively; the same occurred with the average daily temperature, with an increase of 6.2 °C (SG vs OF) and 2.6 °C (SG vs CG). The recorded difference in relative humidity was significant among the three conditions, being lower in the open field (66.14%) than in SG (68.29%) and the conventional greenhouse (69.41%). Growing degree days, calculated with a vertical cutoff at 30 °C and a base temperature of 10 °C, were the same between the conventional and the semi-buried greenhouse on days with precipitation >2 mm, while with rainfall ≤2 mm, the semi-buried greenhouse recorded higher values. The minimum temperatures produced in the semi-buried greenhouse are insufficient for vegetables that require at least 10 °C without depending on auxiliary energies.
rtalizas que requieren un mínimo de 10 °C sin depender de energías auxiliares.climate management, passive heating, protected agriculture, thermal inversion.
The area under protected agriculture (PA) in Mexico reached 77 417 ha by 2022, which is the result of an average annual growth rate of 6%. The State of Mexico is the state with the largest greenhouse area (3 489 ha) (SIAP 2015; INEGI, 2022), and tomato is the predominant olericultural species in 41.4% of greenhouses in the State of Mexico (INEGI, 2022).
Fifty point five percent of the production units with PA in the State of Mexico are located in the High Valleys region and are characterized by being located between 2 200 and 2 600 masl, having a temperate subhumid climate with summer rainfall, and having temperature ranges of 6.5-22 °C in the warmest months and -3 to 18 °C in the coldest months (INEGI, 2023).
In the High Valleys, minimum daily temperatures (<10 °C) that occur from the beginning of autumn constrain the production of high-value vegetables, even in conventional unheated greenhouses, because the thermal jump produced by the plastic cover is only 1 to 3 °C above that of the open field. On nights with clear skies, no wind and low environmental humidity, temperatures can be colder than outdoors (Castilla, 2013; Grisey et al., 2023).
Methods for heating the plant environment include operating passive and active systems. Passive systems tend to reduce the rate at which heat is lost at night, whereas active systems add heat to the environment at a higher rate than the enclosure loses it, thus maintaining the desired temperature (Ahamed et al., 2018). Although operating both systems yields the best results, this requires substantial economic investments that are not accessible to most medium-sized producers and all small producers.
Semi-buried greenhouses (SGs) are an alternative for passive climate management (Brunetti, 2025b). The state of the art on SGs keeps research focused on analyzing the phenomenon and its functional optimization during the cold season; nonetheless, Brunetti (2025a) recommends studying the technology throughout the year.
This study is socially relevant because smallholder producers in Mexico have a shortage of technology, infrastructure and economies of scale, making them vulnerable; their losses, even if small, significantly damage their patrimony (Reséndez et al., 2011).
The research aimed to compare temperature, relative humidity, and vapor pressure deficit across three environments (open field, conventional greenhouse and semi-buried greenhouse) in the municipality of Morelos, State of Mexico, using sensors to extend the production window for high-value crops in unheated greenhouses during autumn.
The study was conducted in a plot located in the municipality of Morelos, State of Mexico, at coordinates 19° 45’ 13.17” north latitude and 99° 41’ 31.34” west longitude, with an altitude of 2 600 m. The minimum and maximum monthly normal temperatures in the warmest quarter range from 6.3 to 23.1 °C, while in the coldest quarter they range from 0.5 to 18.6 °C (CNA, 2025).
The site has a temperate, subhumid climate with summer rainfall; in autumn, precipitation and temperature decline (with cold mornings and nights), relative humidity drops and the number of clear days increases.
The study was carried out in two north-south oriented, single-span greenhouses, each measuring 96 square meters (8 m wide x 12 m long), with a height of 3.4 m to the base of the arch, a roof vent and an east-facing window 0.65 m wide. These dimensions represent the smallest production units in the region.
One greenhouse is located at ground level; this was called a conventional greenhouse (CG). The second, called a semi-buried greenhouse (SG), is placed at a depth of 1.7 m; on its periphery, a perimeter wall was built with solid construction blocks 12 cm thick until it reached ground level; from there, the column is placed at a height of 1.7 m to the drainage channel, resulting in a distance from the subsoil to the base of the arch of 3.4 m. The volume/area ratio of both models was 4.48 m3 m-2 to eliminate the noise that could be caused in thermal inertia due to the difference in proportions.
On the north wall of SG, a double layer of white, 720-gauge (0.18 mm) low-density polyethylene with 25% global visible light transmission (GVLT) was installed; between the two layers, four white expanded polyethylene foam canvases were placed, achieving a total thickness of 2.54 cm. On the south wall and the roof, two 720-gauge plastic films with 85% GVLT each were installed, yielding a cumulative value of 72.2% when in direct contact.
The ventilation curtains were made of a single layer of plastic, matching the color and thickness used for the roofs. The inner face of the block walls was covered with a 0.63 mm layer of expanded polyethylene foam. The floor was covered with a 5 cm thick layer of gray construction sand.
On all walls and the roof of the conventional greenhouse, only a single layer of 720-gauge white polyethylene film with 70% GVLT was placed because this color and transparency are most commonly used in greenhouses in the region. Although it was advisable to include plastic films with the same GVLT as in the semi-buried model, at the commercial level in Mexico, no 720-gauge plastics with 72.2% GVLT are available.
In both greenhouses, the presence of weeds and crops was avoided to prevent biases in the relative humidity derived from plant evapotranspiration. In both greenhouses, the roof vent and side windows were covered on the outside with a layer of crystal-white anti-aphid net [16 x 10 threads per square centimeter (tpc)], which generates a shade of 26.4%. The vents were manually operated with winches and a torsion guide.
The ventilated area ratio was 75.7 and 40.7% for the conventional greenhouse and the semi-buried greenhouse, respectively. As for the exposed area, it was 271.4 m2 for the conventional greenhouse and 203.4 m2 for the semi-buried greenhouse.
Because the side and roof vents of the greenhouse were manually operated, they were opened between 10:50 and 11:00 h and closed between 15:40 and 15:50 h; the nature of the opening mechanism allowed them to be kept only fully open or fully closed.
Three data loggers (one for each environment: OF, CG and SG), model RHT10 (Teledyne FLIR, 2025), were used. They were placed inside a Seeed Studio model 114992222 shield to protect against solar radiation, with natural ventilation and were mounted on the mast of a tripod that kept them 1.55 m above floor level; the base was positioned at the center of each greenhouse. The software for downloading the data was provided by the manufacturer of the loggers (Extech Instruments, 2019).
Because rainfall still occurs in the first half of autumn and can alter soil thermal conductivity, it was considered relevant to include daily precipitation (mm day-1) data generated by the NASA data access viewer (NASA, 2025) in the different analyses.
During the data collection period (September 18 to December 17, 2025), ambient temperature (°C) and relative humidity (%) were recorded every 10 min. This information was used to calculate the following response variables for the Open Field (OF), conventional greenhouse (CG), and semi-buried greenhouse (SG): the difference in minimum temperature (°C) among OF, CG and SG.
Growing degree days (GDD) are the units of the total amount of heat required, between the lower and upper thresholds, for an organism to develop from one point to another in its life cycle. The numerical integration method, with and without a vertical cutoff, was selected, considering 10 °C as the base temperature (Tmin) and 30 °C as the maximum temperature (Tmax) (Shamshiri et al., 2018).
This calculation eliminates unnecessary biases that are generated in other models, such as single average, triangular average, sine and even double sine models. The vertical cutoff better represents crop physiological behavior when exposed to temperatures above the biological maximum (thermal stress, stomatal closure, photosynthesis stoppage, pollination deficiencies and fruit set, among others) (Visakh et al., 2026).
Daily time (hours) during which the vapor pressure deficit (VPD) is in the range of >0.8-1.5 kPa during the day, considered the minimum and maximum in tomato cultivation under greenhouse conditions (Shamshiri et al., 2018). The VPD was calculated using the ASAE EP505.1 APR2015 (R2024) standard (ASABE, 2024), taking into account Allen et al.’s (1998) formula for saturation vapor pressure.
The records come from ambient temperature (°C) and relative humidity (%) readings taken every 10 min (144 readings day-1) for 91 days, from September 18 to December 17, 2025, across the three experimental environments. A total of 13 070 valid readings were obtained. Statistical analysis was performed using the RStudio package, version 2024.12.1, R Core Team (2024).
During the analysis period, the minimum daily temperature inside CG was, on average, 1.07 ±0.59 °C higher than in OF, consistent with Castilla’s (2013) reports, which attribute the low gradient to polyethylene’s permeability to infrared radiation, a situation that is aggravated when combined with small greenhouses, which have a greater exposed area that accelerates heat loss by radiation and conduction.
Despite the difference in minimum temperatures between CG and OF, a means comparison test (Kruskal-Wallis) confirmed that there was no significant difference between them (p-value= 0.052).
The thermal gain of SG over OF was 4.42 ±1.81 °C; the means comparison test (Kruskal-Wallis) showed significant statistical differences (p-value= 0.001). These results exceeded those obtained by Arana (2013), who recorded average gains of 2.5 °C when comparing the minimum temperature of OF with that of an SG in El Marqués, Querétaro, and also surpassed the 3.11 °C obtained by Aguilar (2018) in a Chinese-type asymmetrical greenhouse in Chapingo, State of Mexico.
This thermal increase of 1.92 °C is attributable to differences in the thickness of the plastic covers, the number of layers used in the present experiment, and the insulation of the north wall with polyethylene foam, because Arana (2013) used only a 600-gauge plastic film with a horizontal aluminized thermal screen that was extended at night and retracted during the day.
Regarding ambient temperatures (°C), the statistical results indicated the existence of significant differences among OF, CG, and SG (p-value= 0.001), including in their paired comparisons. This aligns with findings by Goodarzi et al. (2023), who compared CG and SG at - 1.5 m (Table 1).
| Comparison | Difference in means | Standard error | 95% CI | p |
|---|---|---|---|---|
| OF vs CG | -3.603 | 0.0695 | (-3.834, -3.373) | <0.052 |
| OF vs SG | -6.107 | 0.0695 | (-6.338, -5.877) | <0.001 |
| CG vs SG | -2.504 | 0.0695 | (-2.734, -2.274) | <0.001 |
Thermal inversions occurred on the nights of October 28-29 and November 9-10, 2025, when the minimum temperature difference between CG and OF was -1.5 °C and -0.1 °C, respectively. Espinal et al. (2015); Hernández et al. (2022) state that the phenomenon occurs when clear skies, cold nights and little wind coincide. Between SG and OF, there was no temperature inversion, although on the nights of October 9 and 10, the gain was only 0.2 °C.
Growing degree days (GDD) differed among OF (314.2), CG (448.8), and SG (527.2). The capacity of SG to accumulate 67.8% and 17.5% more useful thermal energy than OF and CG, respectively, during this period indicates that the semi-buried greenhouse temperature will help maintain crop growth in the same proportion (Table 2).
| Comparison | Difference in means | Standard error | 95% error | p |
|---|---|---|---|---|
| OF vs CG | -0.264 | 0.00776 | (-0.29-0.238) | <0.001 |
| OF vs SG | -0.376 | 0.00776 | (-0.402-0.35) | <0.001 |
| CG vs SG | -0.112 | 0.00776 | (-0.138-0.086) | <0.001 |
Despite SG’s greater efficiency, daily monitoring of GDDs enabled us to identify two situations: on days with precipitation >2 mm, GDD accumulation is the same between CG and SG (p= 0.857); by contrast, with little (≤ 2 mm) or no rainfall, SG has a significant advantage (p= 7.36 x 10⁻⁶) (Figure 1).
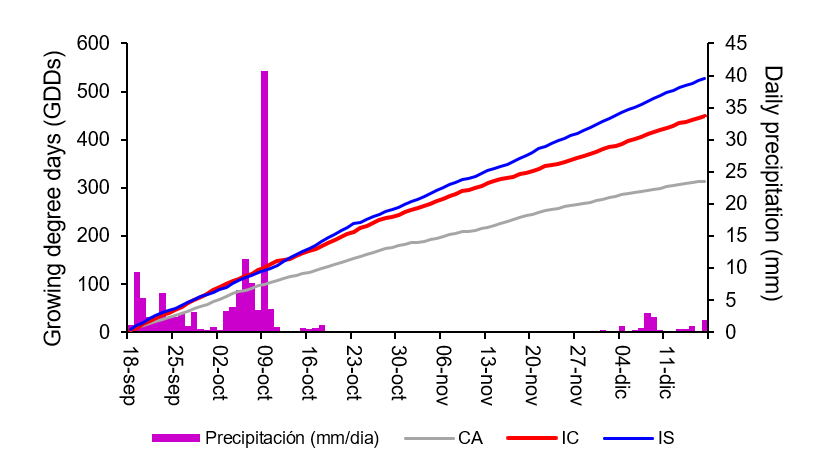
This may be because rainfall greater than 2 mm saturates the topsoil and the excavated area with water. According to (Markert and Wessolek, 2016), the high thermal conductivity derived from moist soil and other factors accelerates the loss of heat accumulated in the walls to the cold outside and activates an evaporative cooling process.
Soil moisture exhibits high daily variability that is strongly correlated with evaporation (Cheruy et al., 2017); however, at high or mid-latitudes, soil moisture, by controlling thermal inertia, reduces the impact of daytime evaporative cooling by decreasing nighttime cooling.
This results in a drastic decrease in its thermal damping capacity, dissipating energy into the atmosphere until it matches open-field temperature values (Zhang et al., 2021); the phenomenon persists as long as moisture saturation conditions remain; evidence of this was the accumulation of GDDs that occurred on October 9, when precipitation of 40.7 mm was recorded; although CG accumulated 14.3% more GDDs than SG, the following day (October 10) this difference was even greater (20.4%) despite precipitation of only 3.5 mm and that this second day had an average daily temperature in the open field higher than 0.77 °C.
Relative humidity (%) showed statistical differences in each of the three environments (Kruskal-Wallis, p= 6.68 x 10⁻²⁰), including their paired comparisons, with averages OF (66.1%) <SG (68.3%) <CG (69.4%) (Table 3). In OF, wind displaces the air mass and produces the lowest relative humidity values, whereas in the protected environments (CG and SG), plastic covers form a barrier that reduces internal wind speed, thus increasing the amount of humidity (Qianjun and Hongwei, 2024).
Between CG and SG, the difference in humidity was due to SG’s excavated soil acting as a natural heat sink and insulator. This maintains a higher indoor temperature at night and a cooler temperature at midday than in CG. This thermal inertia reduces extreme peaks in relative humidity; especially at night, the increased nighttime heat raises the air’s saturation capacity, preventing condensation and resulting in an overall average slightly lower than that of CG.
For the variable ‘vapor pressure deficit (VPD)’ a statistically significant difference was also observed among OF, CG, and SG (Kruskal-Wallis, p= 1 x 10⁻⁶) as well as in their paired comparisons (Wilcoxon), with the averages being SG (0.58 kPa) >CG (0.84 kPa) >OF (0.95 kPa) (Table 3).
The analysis of the time (hours) during which the VPD remained within the optimal range for the tomato crop (>0.8-1.5 kPa) also revealed the presence of statistically significant differences (Kruskal-Wallis, p= 9.6 x 10⁻⁶). The pairwise comparison (Wilcoxon) shows that OF vs CG and SG have significant differences (p= 1.9 x 10⁻¹²); nevertheless, CG and SG are not different (p= 0.77).
Finally, when evaluating the effect of precipitation on VPD on both rainy (>2 mm) and dry (≤2 mm) days, a student’s t-test confirmed the absence of significant differences among OF, CG and SG (p= 0.761).
The changes produced by the semi-buried greenhouse (SG) relative to the open field (OF) and conventional greenhouse (CG) are: a significant increase in the minimum temperature of 4.42 °C and 3.35 °C, respectively, and an increase in the average daily temperature of 6.2 °C and 2.6 °C, in the given order.
The recorded differences in relative humidity were significant among the three conditions, being lower in OF (66.14%) than in SG (68.29%) and CG (69.41%).
During the day, the growing degree days (GDDs) in SG accumulate 67.8% >OF and 17.5% >CG. On days with precipitation >2 mm, the GDDs that accumulate in CG and SG are not statistically different; in contrast, on days with little (≤2 mm) or no rainfall, a statistical superiority of SG compared to CG (22.9%) is observed.
The minimum temperatures generated in the semi-buried greenhouse remain insufficient to produce horticultural crops that require a biological minimum of 10 °C without relying on auxiliary energies (solar, electrical and fossil fuels, among others).
It is recommended to continue measuring variables while preserving the experiment’s technological characteristics for at least one year to identify variable behavior in the remaining climatic seasons. Additionally, it is recommended to incorporate the measurement of specific humidity to eliminate the noise caused by the ambient temperature when interpreting humidity.
We thank the State of Mexico Council of Science and Technology AC, for financing the infrastructure under the COMECYT 2025 researchers’ program.
ASABE. 2024. American Society of Agricultural and Biological Engineers. Asae Ep505.1 APR2015 [R2024]. Measurement and reporting practices of automatic agricultural weather stations. Norma Technical. https://webstore.ansi.org/standards/asabe/asaeep505apr2015r2024?srsltid=afmboooxhkcp9qz9a0qx6hl9vj9giwrfzsrxfve7qhuaxpdgpqqhgwyb.
Cheruy, F.; Dufresne, J. L.; Aït-Mesbah, S.; Grandpeix, J. Y. y Wang, F. 2017. Papel de la inercia térmica del suelo en la temperatura superficial y la retroalimentación humedad-temperatura del suelo. Journal of Advances in Modeling Earth Systems. 9(8):2906-2919. https://doi.org/10.1002/2017MS001036.
CNA. 2025. Comisión Nacional del Agua. Normales Climatológicas (1991-2020) de la estación 15071, Presa El Tigre. Comisión Nacional del Agua. Coordinación General del Servicio Meteorológico Nacional. Base de datos climatología nacional. Disponible en: https://smn.conagua.gob.mx/es/climatologia/informacion-climatologica/informacion-estadistica-climatologica.
Goodarzi, M.; Hydayatipour, A. and Ghadbeiklou, J. 2023. The feasibility of underground greenhouses construction as an action to reduce climate change impacts. Journal of Drought and Climate Change Research. University of Birjand-Research Group of Drought and Climate Change. 1(2):53-62. https://doi.org/10.22077/jdcr.2023.6016.1011.
Hernández-Rodríguez, J.; Reyes-Requena, R.; Granados-García, M. R. y Lorenzo-Mínguez, P. 2022. Pantallas térmicas. En: Bonachela-Castaño, S.; Hernández-Rodríguez, J.; López-Hernández, J. C.; Lorenzo-Mínguez, P. y Magán-Cañadas J. J. (Eds.). Sistemas pasivos de calefacción en invernaderos mediterráneos. 83-93 pp. Universidad de Almería. Libro digital: sistemas pasivos de calefacción en invernaderos mediterráneos. Campus de Excelencia Internacional Agroalimentario.
Shamshiri, R. R.; Jones, J. W.; Thorp, K. R.; Ahmad, D.; Che, M. H. and Taheri, S. 2018. Review of optimum temperature, humidity and vapour pressure deficit for microclimate evaluation and control in greenhouse cultivation of tomato: a review. International Agrophysics. 32(2):287-302. Doi:10.1515/intag-2017-0005.
Velasco, G. Á. M.; García-Zavala, J. J.; Sahagún-Castellanos, J.; Lobato-Ortiz, R.; Sánchez-Abarca, C. y Marín-Montes, I. M. 2020. Análisis de la variabilidad morfológica de maíces nativos y exóticos en Valles Altos de México. Revista Fitotecnia Mexicana. 43(4a):517-524. https://revfitotecnia.mx/index.php/RFM/article/view/829.
Zhang, W.; Bai, R.; Xu, X.; Liu W. 2021. An evaluation of soil thermal conductivity models based on the porosity and degree of saturation and a proposal of a new improved model. International Communications in Heat and Mass Transfer. 129:105738. https://doi.org/10.1016/j.icheatmasstransfer.2021.105738.