elocation-id: elocation-id: e4173
In conventional agricultural management, soil variability is considered a productive limitation; in contrast, regenerative systems seek to improve soil physical and functional properties. This study aimed to evaluate the spatial variability of volumetric water content (ϴv) and soil penetration resistance (Rp) under two agricultural management systems. The study was conducted during the 2023 autumn-winter cycle in Pabellón, Aguascalientes, in a 0.8 ha area divided into two 0.4 ha plots, where a conventional agricultural system (CAS) and a system with regenerative agricultural practices (SRA) were established. In both systems, systematic sampling was carried out using a 40 × 100 m grid with 5 m spacing, obtaining 160 samples per treatment. Descriptive statistical and geostatistical analyses were performed to assess the spatial variability of ϴv and Rp. Results showed higher values of ϴv and Rp in SRA than in CAS, and a distribution closer to normal for ϴv. Spatial maps revealed greater spatial organization in SRA, suggesting positive effects of regenerative management on soil physical properties.
compaction, geostatistics, regenerative, sustainability, system.
Assessing the spatial variability of soil properties in experimental areas is highly important because it can mask the effects of the applied treatments. Several studies have shown that, even at the level of small experimental areas, variability can be significant ( Hernández et al ., 2018 ; Ciarlo et al ., 2020 ; Guachún, 2022 ; Qu et al ., 2023 ).
Traditionally, experimental design in the field of agronomy is based on block design with randomly distributed treatments with the aim of reducing experimental error ( Clewer and Scarisbrick, 2001 ), enabling the use of conventional methods of statistical analysis, such as analysis of variance and regression, among others ( Montgomery, 2009 ; Tavares et al ., 2016 ).
This consideration implies that spatial variability is random within the blocks, a condition that is not always met ( Jaramillo, 2012 ; Fernández-Aviléz and Montero, 2025 ). As an alternative method for quantifying heterogeneity, the application of geostatistics is proposed, which is used to analyze the structure of the spatial variability of regionalized variables and to optimize their interpolation ( Jaramillo, 2013 ; Abdel Rahman et al ., 2021 ).
Around the world, there are many studies on the spatial variability of soil properties under different edaphoclimatic environments and management types, which rely on the use of geostatistics to explain cause-and-effect relationships.
Most research has analyzed the spatial variability of physical and chemical variables to determine how soil responds to specific uses under certain management practices and to establish its relationship with the productivity of different agricultural crops ( Vargas et al ., 2015 ; Ciarlo et al ., 2020 ; Albornoz-Bucheli et al ., 2022 ; Galindo-Pacheco et al ., 2025 ; Álvarez-Herrera et al ., 2025 ). These studies show that there is no single pattern of soil spatial distribution and that it can be influenced by agricultural management and sampling scale.
This study hypothesizes that the no-tillage system, accompanied by plant residue cover, alters soil structure and stability compared with the tillage system and that this is reflected in the spatial variability of soil physical properties.
Therefore, the objective of this research was to evaluate and compare the spatial variability of soil physical properties, such as volumetric moisture and penetration resistance, in two agricultural management systems (SRA and CAS) in order to identify how management practices influence the distribution and heterogeneity of characteristics such as moisture-holding capacity and mechanical strength, among others and thus provide recommendations to improve the sustainable management of soils in each system.
The study area is located at the INIFAP Pabellón Experimental Field in Aguascalientes, at coordinates 22°11’ North and 102° 20’ West, at an altitude of 1 969 m. The experimental site’s soil is a Xerosol, with the subsoil limited by tepetate, mainly in the duric phase and, more locally, in the deep duric phase. The soil has a medium textural class (crumb-sandy), an alkaline pH of 7.8, less than 1% organic matter, and a terrain slope of 2-3% ( INEGI, 2007 ).
The region’s predominant climate is semi-desert [BS1 kw (w) (e)]. The average annual temperature is 16.7 °C, with a maximum of 20 °C and a minimum of 13.2 °C. The annual accumulated rainfall ranges from 400 to 450 mm, with a summer rainfall regime; winter precipitation accounts for less than 5% of the annual record, and summers are warm ( García, 2004 ).
During the autumn-winter (AW) cycle of 2023, two adjacent plots measuring 40 m × 100 m were delimited and used as experimental units. The first was grown under summer monoculture with conventional tillage; the second, which was at rest, was covered with native grassland. Before the study began, both were prepared using a moldboard plow and a harrow.
Subsequently, the resting plot was sown with triticale ( X. Triticosecale Wittmack) for forage, associated with berseem clover ( Trifolium alexandrinum L.), in order to establish a clover meadow after harvesting the AW cereal and to leave a mulch on the surface for direct sowing of SS crops. The other plot was ready for planting spring-summer (SS) monocultures in 2024.
After harvesting the AW forages, soil volumetric moisture content (ϴv) and penetration resistance (Rp) were sampled. The two variables were determined through systematic sampling using a grid, with a 5 m spacing between intersection or sampling points in a 0.8 ha area divided into two 0.4 ha plots, resulting in a total of 160 sampling points per plot.
This sampling was conducted in the surface layer of the soil at depths of 0-5 cm and 0-15 cm in both systems. Moisture content was determined with a time-domain reflectometer (TDR), whereas penetration resistance was measured with a cone impact penetrometer ( CIMMYT, 2013 ).
Once the data were obtained, measures of central tendency and dispersion (mean, median, standard deviation, maximum, minimum, asymmetry coefficient, kurtosis and coefficient of variation) were estimated. Subsequently, an exploratory analysis of the data, with 160 observations per variable and per treatment, was performed, evaluating their behavior and verifying compliance with normality using the Kolmogorov-Smirnov and Levene tests for homogeneity of variance.
Because highly asymmetric and leptokurtic distributions were observed in the conventional system (CAS), which violates the assumptions of normality required by parametric tests, it was decided to apply Wilcoxon’s nonparametric test (α= 0.05) as the primary analysis for group comparison; the analyses were performed using the RStudio software (version 2024.12.0). In addition, an analysis of the spatial variability of both variables was conducted using geostatistical tools to define and adjust them.
The descriptive statistics for the variables moisture (ϴv) and resistance to penetration (Rp) are shown in Table 1. This table presents the results of the main statistics for the two variables analyzed across the two evaluated management systems.
The summary of the descriptive statistics in Table 1 shows that ϴv exhibited a good correspondence between the mean and the median, indicating populations with symmetric distributions. It can be observed that the means for ϴv are 15.71% and 10.36%, with coefficients of variations (CV) of 41.8 and 41.2% for the two depths sampled (5 and 15 cm) in SRA; in contrast, the means of ϴv in the conventional system (plowing + harrowing) for the two depths are 1.05% and 0.9%, corresponding to CVs of 58 and 77%, respectively.
These results indicate that SRA maintains higher soil moisture and lower variability among samples, suggesting greater uniformity in moisture conservation in the soil profile. This trend aligns with recent studies documenting differences in hydraulic properties and water retention between no-tillage and tillage systems.
In addition, no-tillage tends to improve soil structure ( Jabro and Stevens, 2022 ; Tan et al ., 2025 ). Other studies have found that using waste, along with conservation practices, can positively influence soil water-holding capacity and improve its related physicochemical properties ( Singh et al ., 2023 ).
In the case of Rp, the mean is 0.92 MPa for SRA and 0.61 MPa for the conventional system. In both cases, these levels do not imply any limitation for crop growth ( Bravo et al ., 2011 ). Nevertheless, soil penetration resistance is higher in no-tillage systems because the soil is not disturbed, which favors the natural consolidation of particles and increases the bulk density on the surface; in contrast, conventional tillage temporarily loosens the soil through plowing and harrowing, thereby decreasing penetration resistance ( Demuner-Molina et al ., 2013 ).
Furthermore, in zero tillage, the accumulation of plant residues and organic matter improves aggregate stability and soil structure, increasing surface firmness, while also favoring water infiltration, moisture conservation, and erosion reduction ( Hernández-Sánchez et al ., 2019 ; Gómez-Calderón and Estrada-León, 2019 ), although Rp levels are higher in SRA.
The CVs for the two evaluated variables are relatively high, indicating that ϴv and Rp exhibited medium variability across the two soil management systems. According to Pinzón-Gómez et al . (2016) , variables with a CV> 65% were considered to have high variability, those with a CV between 25 and 65% were classified as having medium variability and those with a CV< 25% were considered to have low variability.
In this analysis, the evaluated variables exhibit medium variability; however, using these values in geostatistical methods can yield robust conclusions. This approach aligns with previous studies that have used spatial analysis of soil properties to determine patterns of spatial variability ( Subhash et al ., 2025 ).
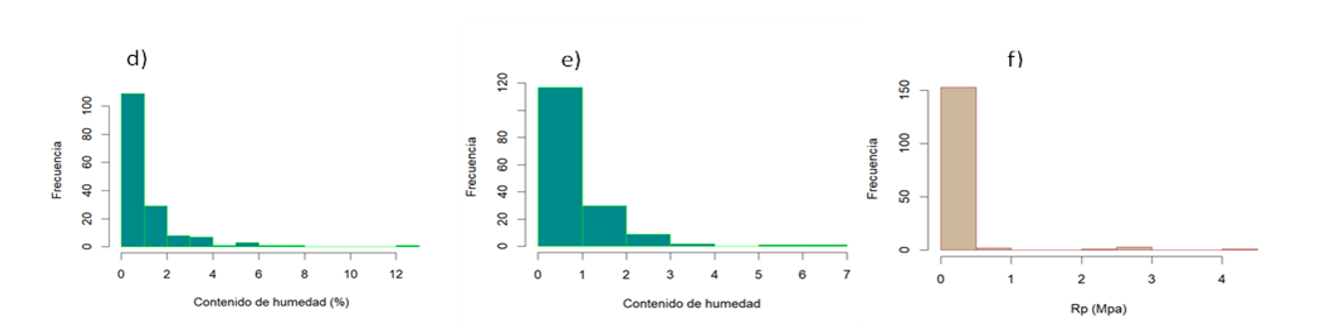
Figures 1 and 2 show the frequency histograms corresponding to both variables.
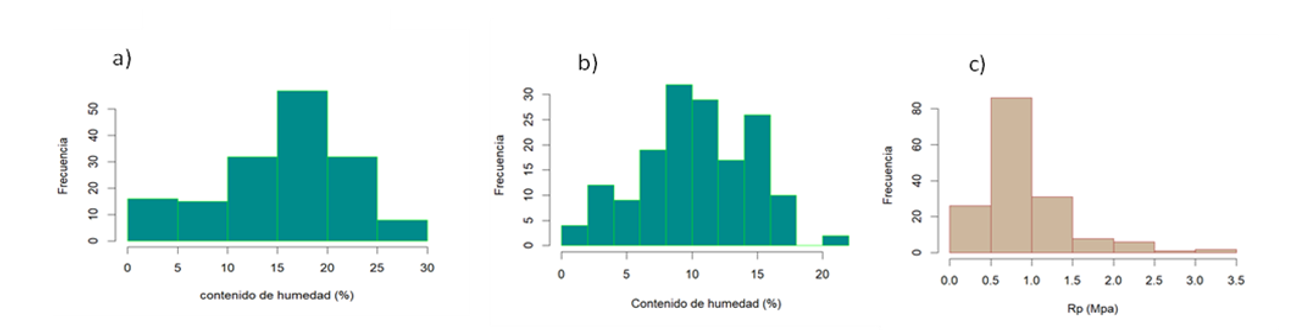
Regarding asymmetry values, in the case of ϴv, SRA showed negative values at the two evaluated depths, indicating that the data distribution had a tail to the left, concentrating most values in high ranges, as observed in the histograms of ϴv ( Figure 1a y 1b ). On the other hand, for Rp the asymmetry was positive, with a slight tail to the right, reflecting that most of the data were concentrated at low values ( Figure 1c ).
In the case of the conventional system, ϴv and Rp showed high values of positive asymmetry, indicating that the data distribution has a tail to the right, with most values concentrated in low ranges, as shown in the histograms.
According to some reports in the literature, for a normal and symmetric distribution, the coefficients for asymmetry and kurtosis should be 0 and 3, respectively ( Adhikari et al ., 2009 ). To assess normality, the Kolmogorov-Smirnov goodness-of-fit test was conducted on both variables for the two management systems.
The variable ϴv yielded a D-statistic of 0.0815 and a p-value of 0.0113 at the depth of 5 cm, and at 15 cm, the statistics were D= 0.0531 and p-value= 0.3286. Based on these results, it can be interpreted that only the ϴv at 15 cm exhibited a normal distribution. On the other hand, the variable Rp obtained a D-statistic of 0.1807 and a p-value of 6.164e-14, which concluded that the data for this variable did not follow a normal distribution at the 0.05 significance level.
In the conventional system, for ϴv at 5 cm, the statistics were D= 0.2567 and p-value= 2.2e-16, whereas for ϴv at 15 cm, the values were D= 0.1864 and p-value= 7.142e-15, confirming that the data for this variable did not follow a normal distribution.
In the case of Rp, the statistical values were D= 0.1483 and p= 2.2e-16, confirming that they did not follow a normal distribution. Nonetheless, it is important to note that most soil physicochemical properties are biased; that is to say, they do not always follow a normal distribution ( Hammer et al ., 1998 ; Webster and Oliver, 2007 ).
The homogeneity of variances was evaluated using Levene’s test ( Levene, 1960 ), the results of which indicated statistically significant differences between the management systems for the variables analyzed: penetration resistance (Rp): F= 16.3, df= 1 318, p< 0.001; moisture at 5 cm: F= 154.98, df= 1 318, p< 0.001; moisture at 15 cm: F= 187.27; df= 1 318, p< 0.001.
Based on these results, Wilcoxon’s nonparametric test was applied, which is less sensitive to the assumptions of normality and homogeneity of variances. This test showed significant differences among the management systems: penetration resistance (W= 24 602, p< 0.001); moisture at 5 cm (W= 25 239, p< 0.001); and moisture at 15 cm (W= 25 384, p< 0.001). This indicated that the evaluated properties changed with the type of soil management.
The spatial variability maps of the two soil physical properties evaluated in both management systems are shown in Figure 3a, 3b and 3c , and Figure 4a, 4b and 4c . In the SRA area, the maps ( Figure 3a y 3b ) show that the highest ϴv values at the depth of 5 cm were found in the south-central zone, and the lowest values in the northern and NW parts. In contrast, the map at a depth of 15 cm shows that the highest values were found in the central-south zone.
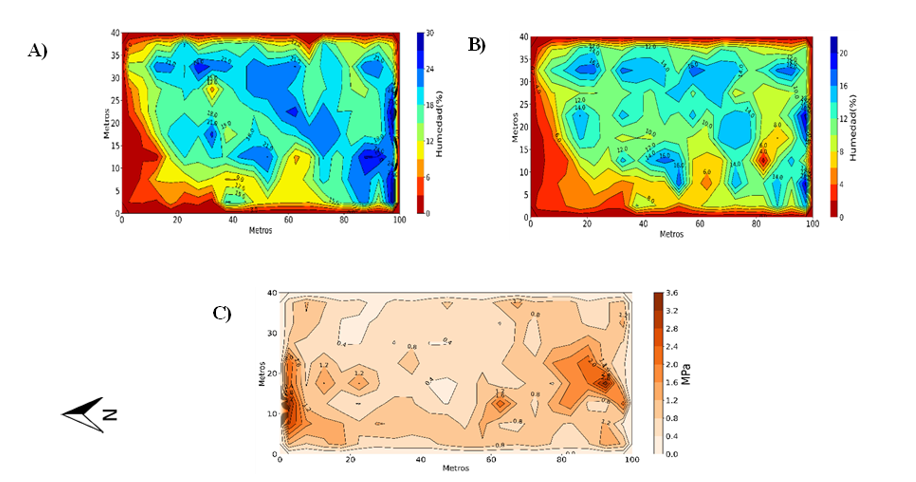
This could affect the variation in the productive response of the crops under study. The Rp map for the same system (SRA) shows values ranging from 0.4 to 3.6 MPa, classified as a low level of compaction. Most of the area presented values fluctuating from 0.4 to 0.8 MPa, with small aggregates whose Rp values exceeded 0.8, reaching a maximum of 3.6, located at the northern and southern ends of the experimental area ( Figure 3c ).
The representation of the ϴv and Rp estimates shows that most of the experimental area of the conventional system had ϴv values below 1% in the 5 cm deep surface layer; in contrast, ϴv values ranged from 0.5 to 1% in the 15 cm deep layer, with some small aggregates whose values were 2% ( Figure 4a y 4b ). In the case of Rp, the values were consistently below 1 MPa throughout the experimental area, with some small aggregates in the southern part of the area, where values ranged from 1.2 to 3.2 MPa ( Figure 4c ).
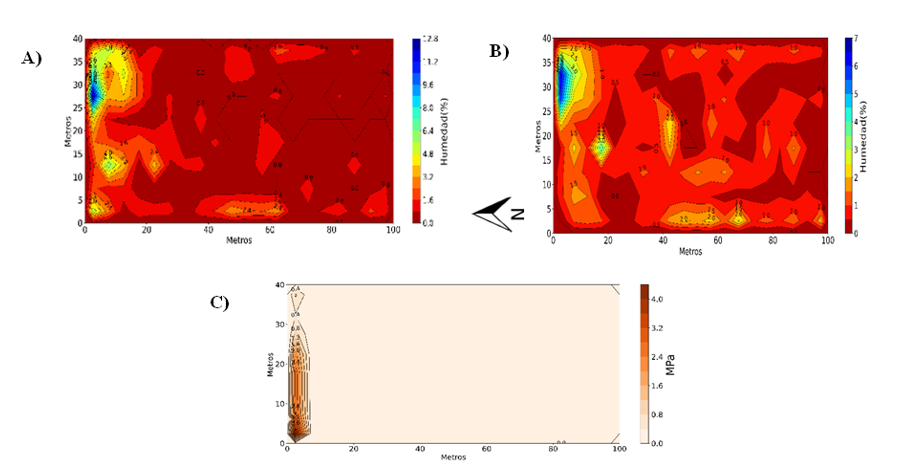
Rp values represent soil penetration resistance, with higher values indicating greater compaction and more difficulty for root growth, while lower values reflect less compact, more root-friendly soil ( Colombi et al ., 2019 ).
Regarding soil moisture, ϴv was consistently low in the conventional system, likely due to reduced plant cover and a lack of residues on the surface, which probably increased evaporation and affected soil structure, thereby limiting water retention in the profile.
This contrasted with SRA, where higher ϴv values reflected greater water retention due to the effect of waste left on the surface as mulch; these results are consistent with those reported by Li et al . (2019) .
The results showed statistically significant differences between the evaluated systems, with higher Rp values and higher moisture levels in the regenerative system (SRA) than in the conventional system (CAS). This indicates that soil properties vary with the management system applied.
In most cases, tillage of agricultural soils leads to deterioration of their edaphological properties and a decline in their productivity. Therefore, incorporating good regenerative practices in soil management, such as direct sowing and keeping crop residues above the soil surface, is a way to improve moisture management and increase its conservation in the profile.
Based on the above, this work has shown that the evaluated soil parameters (ϴv and Rp) presented a good level of spatial dependence, especially in SRA, suggesting the need to consider spatial variability in experimental areas. The application of geostatistics to the spatial characterization of soil parameters represents an important aid in interpreting the results of the tests conducted in the experimental areas.
Therefore, the distribution of the variables studied, as reflected in the maps, could influence yield variability. However, variation in crop yields depends on a set of factors, and soil parameters represent only one of them.
Galindo-Pacheco, J.; Vargas-Díaz, R.; Martínez-Niño, C. y Franco-Flórez, C. 2025. Análisis de variación espacial de la fertilidad del suelo para la delimitación de zonas de manejo homogéneo en agricultura de precisión. Revista Científica Dékamu Agropecuaria. 10(2):25-38. https://revista.unibagua.edu.pe/index.php/dekamuagropec/article/view/289.
Levene, H. 1960. Pruebas robustas de igualdad de varianzas. In: Olkin, I. Ed. Contribuciones a la probabilidad y la estadística, Stanford University Press, Palo Alto. Referencias-publicaciones de investigación científica. 278-292 pp. https://www.scirp.org/reference/ReferencesPapers?ReferenceID=2363177.
Subhash, M.; Sinha, N. K.; Kumar, J.; Mohanty, M.; Sahoo, R. N.; Jayaraman, S.; Kumar, N.; Rani, A.; Thakur, J. K.; Mandal, A.; Kumar, D.; Mishra, R. and Prabhakar, M. 2025. Spatial variability of soil physicochemical properties in soybean wheat belts in Vertisols of central India. Scientific Reports. 15(1):33830. https://doi.org/10.1038/s41598-025-03540-4.