elocation-id: elocation-id: e4120
This study optimized bean distribution routes in Mexico through linear programming to reduce logistics costs. Two scenarios were analyzed: one of a closed economy, which showed that national production is insufficient to meet total demand, and another of an open economy, which considered the production deficit caused by the drought of 2024, which, as part of a growing climatic pattern, intensified pressure on Mexican agricultural production and reduced yields in crops such as beans. This shock widened the structural deficit that Mexico covers with imports. This second model determined the optimal routes for distributing 286 411.31 t of imported beans, identifying the customs offices of Veracruz, Manzanillo and Nuevo Laredo as the main points of entry. The research concludes that the logistical optimization of domestic production and imports is crucial for the country’s food security.
agricultural logistics, food security, linear programming.
Beans are a staple food in the Mexican diet, with great social and economic relevance. In 2024, national production reached 996 392.77 t, a figure insufficient to meet the national apparent consumption of 1 376 310.56 t ( SIAP, 2024 ; FAO, 2024 ), which has increased imports, which went from 286 411.31 t in 2023 to 409 366.16 t in 2024, a 42.9% increase ( FAO, 2024 ).
Added to the above are logistical deficiencies that raise costs and affect consumers, especially the most vulnerable. In this context, optimizing distribution becomes a key strategy for improving commercial efficiency and food safety.
Of the 996 392.77 t of beans produced in 2024, 70% of production is concentrated in the states of Zacatecas (342 452.16 t), Sinaloa (172 238.91 t), Nayarit (70 050.6 t), Chiapas (69 711.88 t) and Durango (58 574.82 t), while consumption is mainly located in urban areas in the center and south of the country ( SIAP, 2024 ). Nevertheless, the current system lacks optimized models, which generates higher costs and loss of efficiency in the value chain.
Faced with this problem, the following question arises: Is it possible to optimize national bean transport routes to reduce distances and improve logistics? This study aims to determine optimal transport routes through linear programming, thereby minimizing the total distance traveled and satisfying demand in two scenarios: one closed, considering only national production and the other open, incorporating imports through customs. Under this premise, it is hypothesized that applying linear programming models will allow the identification of more efficient routes that reduce logistics costs and improve access to beans across different regions of the country.
This work was based on a quantitative and applied approach. A linear programming model was built using the simplex method, which allows finding the most efficient distribution of beans from the supplying states to the demanding states, thereby minimizing the total distance traveled ( Castillo-Altamirano et al ., 2024 ).
Data on bean production volume by state were collected from the Agrifood and Fisheries Information Service (SIAP, by its Spanish acronym). The data on population by state were taken from the National Population Council (CONAPO, by its Spanish acronym) 2024 census and the records of bean imports were obtained from the Banco de México, 2024 . State consumption was determined using the national apparent consumption (NAC): NAC= national production+imports-exports; it should be noted that the national production used included both rainfed and irrigated production.
Subsequently, per capita consumption (NPC) was obtained by dividing NAC by the total population in 2024: NPC= NAC/total population. The state apparent consumption (SAC) was obtained by multiplying NPC by the state population corresponding to each state: SAC= NPC*state population.
A matrix was constructed in which the rows represented the demanding states, and the columns represented the supplying states. Each combination was assigned a distance in km obtained through the ‘point-to-point route’ system of the Secretariat of Infrastructure, Communications and Transport ( SICT, 2025 ); this variable only considers the distance of origin-distance and does not account for explicit costs, volumes or temporality.
The linear programming model for a closed economy was as follows: the objective function minimizes, in both scenarios, the generalized cost of transportation, expressed dimensionally in tonne-kilometers (t km). This unit represents the actual physical work performed by the logistics system, correcting the previous interpretation of ‘t km’.
For the closed-economy scenario, the solved model responds to the following formulation:
Where: Xij= quantity of beans to be transported from state i (supplying) to state j (demanding), expressed in tons; Cij= distance between state i (supplier) and state j (demanding), expressed in km; For all i= 1, 2, ..., m supplying states; j= 1, 2, ..., n demanding states.
National supply restriction: no more than what is produced in each supplying state may be distributed:
Where: Ei= bean supply of state i, expressed in tons.
Demand restriction: the supply is limited by the real demand, allowing deficits to be identified,
Where Dj= demand expressed in tons of beans from state j; restriction of non-negativity:
In the closed-economy scenario, only the national rainfed and irrigated production obtained from the 32 states was considered. In the open-economy scenario, the 38 customs offices (border and maritime) were added as entry points for imported legumes to take the import quantities of beans and distribute them to the areas of greatest consumption.
The open economy model is as follows:
Where: Xij= quantity of beans to be transported from state i (supplier) to state j (demanding); Cij= distance between state i (supplying) and state j (demanding); Mkj= quantity of beans imported by customs k to state j (demanding), using only the 38 customs offices (maritime and land border); Bkj= distance between customs office k and state j (demanding).
Subject to the restriction of domestic supply, imported supply and domestic demand:
Where: Ei= bean supply of state i; Mkj= supply of beans imported by customs k; Dj= bean demand of state j. The model was solved using LINGO 18.0, which enabled the calculation of the optimal distribution routes under each scenario.
In the closed-economy scenario, where foreign trade was not considered, six states of the republic were identified that managed to satisfy their local demand and generate a surplus to distribute. The value of the objective function was 296 077 092 t km. This value represents the minimum total distance, weighted by volume, that must be traveled to transport all surplus beans from the six producing states to the 26 deficit states, ensuring a complete supply of the national demand.
This result indicates that, under the model’s conditions, it is possible to guarantee the complete supply of national demand through an efficient spatial allocation that minimizes the logistics costs associated with internal transport. The results obtained for the closed market are presented in Table 1 below, which details the optimal distribution routes from each supplying state to the demanding states, as well as the total volume that each supplying state distributes.
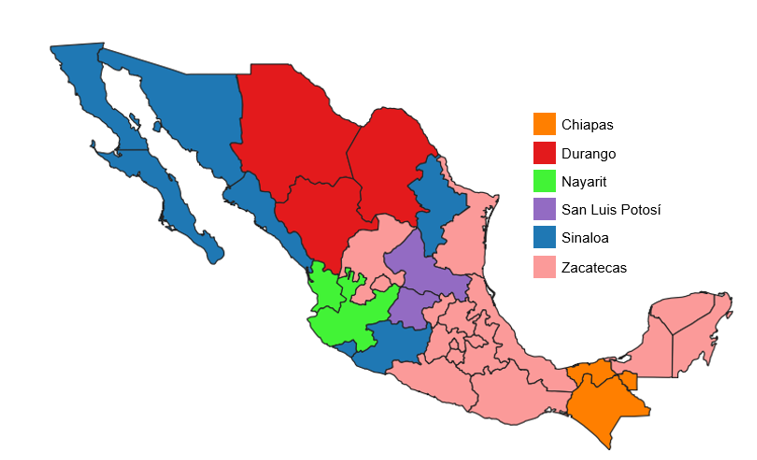
Zacatecas, as the state with the largest quantity of beans available for distribution, had a total of 326 827 t. This origin supplies seventeen destination states, of which the State of Mexico receives the largest part, with 49.72% (162 507.78 t) of its supply, followed by Mexico City, which receives 26.71% (87 292.27 t).
The second-most-important supplier is Sinaloa, which distributes 143 158.76 t. Its main destination is Michoacán, to which Sinaloa supplies 28.77% of its surplus, equivalent to 41 188.7 t, followed in importance by Baja California with 25.74% (35 845.49 t) and Nuevo León with 19% (27 279.67 t) of its supply. Nayarit distributes 57 909.62 t, with the state of Jalisco as its only destination, accounting for 100% (57 909.62 t). For its part, Durango supplies a total of 40 630.95 t, sending its largest volumes to Coahuila (74%) and Jalisco (21.38%).
The remaining states distribute smaller amounts. Chiapas supplies 13 373.2 t, distributed only in Tabasco. San Luis Potosí provides 11 123.78 t to the national supply, all of which are sent to the demand of Guanajuato. It was observed that some demanding states, such as Jalisco, Guanajuato and Nuevo León, are supplied by more than one supplying state to meet their needs, which shows the complexity of the national distribution network.
Despite route optimization, the amount supplied by national origins only manages to cover a portion of the country’s total demand, suggesting that, in a real scenario, imports play a crucial role in complementing national demand for beans across the territory.
Figure 1 details a coverage map by distributing state and shows the reach of the six suppliers, with Zacatecas standing out with coverage of the center and southeast of the country; for their part, Durango and Sinaloa cover the demand of the north; Nayarit, San Luis Potosí and Chiapas cover demands close to the states themselves.
Regarding the open-economy scenario, national bean production in 2024, at 996 392.77 t, was drastically affected by one of the most severe droughts in recent decades ( Vaca-Genuit and Reyes-Hernández, 2025 ). This climatic phenomenon caused a loss of more than one million ha of crops nationwide, with beans among the most affected. The state of Zacatecas, a pillar of national production, experienced a drop in its harvest of up to 52.2% compared with previous years, a collapse that affected the entire supply chain ( Guzmán-López et al ., 2024 ).
As a direct consequence of this decrease in production, Mexico was forced to resort to the foreign market on an unprecedented scale. Bean imports into Mexico during 2024 reached historic levels, far exceeding initial estimates. Although the preliminary data for the national balance projected a volume close to 82 580.61 t, the consolidated reports revealed a substantial increase.
According to the Agrifood and Fisheries Information Service ( SIAP, 2024 ), the 2023-2024 commercial cycle closed with 464 000 t imported, representing a 134.3% increase compared to the previous cycle. On the other hand, 313 000 t were imported in 2023, and by 2024, a record volume of more than 400 000 t was projected, thereby consolidating the Mexican diet’s dependence on foreign beans ( Aduanas y Comercio, 2024 ).
This increase highlights the supply chain’s vulnerability to climatic phenomena and the need to implement more efficient logistics strategies. The model results show that the imports needed to satisfy the remaining domestic demand are optimally channeled through 10 of the 38 customs offices considered, which are identified in Table 2 .
These customs offices, both border and maritime, become strategic origins due to their proximity to the main deficit states. The optimization of these import routes not only seeks to reduce transportation costs but also contributes to improving product availability and stabilizing prices for the final consumer, a factor of utmost importance given the status of beans as a pillar of the Mexican basic basket.
However, other factors should be considered for a better overview of availability, such as production seasonality and its availability, remembering that this work has a limited scope, as it only estimates distribution quantities.
Three of the ten selected customs offices (Manzanillo, Nuevo Laredo and Veracruz) stand out for their strategic importance, channeling the largest volume of bean imports due to their infrastructure and their privileged geographical location, close to the states with the greatest deficit; the concentration of imports by customs office of entry can be observed, with the three customs offices referred to above standing out.
The three customs offices stand out for their preponderant role, jointly channeling 71% of total imports: Veracruz, Manzanillo and Nuevo Laredo. Veracruz ranks as the main port of entry for imported beans, handling an optimal flow of 89 887 t (30% of the total). Manzanillo, in Colima, is the second most important entry point, with an assigned flow of 65 403 t (22%). This port is the most important port in Mexico on the Pacific coast, and its relevance in the model is explained by two key factors.
First, its infrastructure includes a specialized terminal for handling agricultural bulk goods with a capacity of 45 000 t, refrigerated cargo terminals, and a modern road and rail transport network that connects it to the heart of the country ( CBRE Research, 2022 ). Second, its position in the Pacific is ideal for receiving imports from South America, such as those from Argentina, an emerging supplier to Mexico.
On the other hand, Nuevo Laredo, in Tamaulipas, consolidates itself as the third most relevant origin and the main land entry point, with a flow of 58 731 t (19%). Its selection is a direct consequence of the geography of the bean trade, with the United States being Mexico’s main supplier.
Other studies indicate that Mexico has the potential to achieve food self-sufficiency in beans through comprehensive policies and the adoption of sustainable agricultural technologies. Borja-Bravo and García-Salazar (2022) showed that implementing the Fertilizers for Well-being Program could increase national production by 22.1%, thereby reducing the need for imports and generating significant economic benefits.
In addition, Ayala-Garay et al . (2021) argue that genetic improvement and the use of certified seeds are key factors in raising yields and ensuring productive stability. Ruiz and Ruiz (2021) emphasize that agricultural biotechnology and the conservation of agrobiodiversity strengthen the resilience of the production system to climate variability, ensuring food sovereignty.
Likewise, De Luis-Peralta et al . (2025) emphasize that the profitability and competitiveness of beans can be consolidated through public policies aimed at rainfed crops. These findings confirm that Mexico not only has the productive capacity but also the technical and political tools to ensure domestic bean supply without depending on foreign trade.
In another study, using a spatial equilibrium model of the Mexican bean market, it was concluded that in drought scenarios, national supply falls, producer prices rise, and imports increase, even if there are no restrictions on external purchases ( Borja-Bravo et al ., 2023 ). This result reinforces that, under real climatic conditions, self-sufficiency is not sustainable.
Findings by Han and Singh (2023) document how the correct estimation of PET and the combination of multiple indices is essential to monitor droughts that, due to climate change, are more frequent and severe; the practical corollary for rainfed crops such as beans is that the probability of chronic water deficit increases, with direct implications on yields and food security.
On a global scale, in yield gap closure scenarios, simulated potentials are often more optimistic than empirical ones, and methodological choices strongly alter self-sufficiency results; applied to the Mexican context, this suggests that ‘self-sufficiency’ goals based on theoretical potentials underestimate real constraints ( Ollenburger et al ., 2022 ).
In this sense, Wu et al . (2024) demonstrate, with variable-weather drought indicators and propagation analysis, that the transition from the meteorological deficit to the agricultural deficit takes 1 to 4 months and affects spring-summer more strongly, just when rainfed beans depend on timely rains; this propagation window makes reactive policies late and make the system to require imports to stabilize consumption.
In parallel, the link between water stress and agricultural productivity anomalies is robust; Chen et al . (2024) find significant correlations between SPEI at 3-6 months and productivity anomalies, highlighting that rainfed systems present prolonged disturbances under drought, consistent with sustained losses in staple crops.
At the local hydrological level in bean-growing areas, the simulations confirm very restrictive water balances. In a semi-arid basin in southern Zacatecas, Hernández-Marín et al . (2024) calibrate and validate the model Soil and Water Assessment Tool (SWAT), a semi-distributed hydrological and eco-hydrological model designed to simulate, continuously, the processes of runoff, evapotranspiration, infiltration, water balance, erosion, sediment transport and water quality in watersheds, where they found that >90% of precipitation is lost by evapotranspiration, and only 8.6% corresponds to runoff, which limits the effective availability of water for agriculture and conditions yields in irrigation systems and with greater severity in rainfed conditions. Such physical restrictions make it impossible to sustain production increases of the order required to supply imports without massive and persistent structural investments.
Finally, Mexico’s commercial dependence on the United States of America for beans has become a determining factor for the stability of the domestic market. Trade liberalization and the lack of effective policies to strengthen national production have increased imports, mainly from the United States of America. This situation generated vulnerability to international fluctuations and limits the response capacity of the national production system ( Caballero-García et al ., 2025 ).
On the other hand, the transmission of prices between producing regions and consumption centers in Mexico reflects partial market integration, which amplifies the effects of external variations. Recent research indicates cointegration and causality in bean prices between areas such as Zacatecas and Mexico City, indicating that changes in international prices can affect the domestic market through indirect mechanisms ( González-Andrade and Aguilar-López, 2024 ).
This behavior confirms that trade dependence is not only a phenomenon of import volume but also of price formation, which compromises the supply of this product to the entire country and the economic stability of producers.
The results confirmed that national bean production in 2024 is insufficient to meet domestic consumption, and that current distribution routes do not allow this gap to be compensated for efficiently. Linear programming enabled us to demonstrate that, in a closed scenario, domestic supply cannot meet territorial demand, indicating a structural insufficiency that logistics alone cannot solve without the support of imports. By incorporating an open scenario, the model identified that flows from ports and border customs, particularly Veracruz, Manzanillo and Nuevo Laredo, are decisive in closing the supply-demand gap and ensuring supply in the country’s most populous regions.
Likewise, the optimized models validated the hypothesis proposed: it is possible to reduce distances, logistics costs and inefficiencies through the mathematical assignment of routes. The optimization showed a territorial reconfiguration of strategic nodes and revealed that logistics based on quantitative criteria contributes to improving food security in a context of climate change and greater dependence on imports. These findings underscore the need to strengthen the country’s rail and port infrastructure, especially in the southeast and Pacific, to ensure a distribution system capable of responding efficiently when domestic production is compromised.
De Luis-Peralta, A.; Vega-Valdivia, D. D.; Garza-Bueno, L. E. y Barrios-Puente, G. 2025. Análisis de la política agrícola en México: rentabilidad, competitividad y autosuficiencia alimentaria en granos básicos. Agricultura, Sociedad y Desarrollo. 22(1): 107-122. https://doi.org/10.22231/asyd.v22i1.1693.
Hernández‑Marín, M. A.; Ortiz‑Gómez, R.; Zavala, M.; Rodríguez‑Rodríguez, J. A.; Alvarado Medellin, P. and Ortiz‑Robles, F. A. 2024. Hydrological simulation using the SWAT model in a semi‑arid region in the southern part of Zacatecas, Mexico. Environmental Earth Sciences, 83(540):1-16 https://doi.org/10.1007/s12665-024-11837-2.
Wu, C.; Xu, Y.; Jin, J.; Zhou, Y.; Nie, B.; Li, R.; Cui, Y.; Tong, F. and Zhang, L. 2024. Meteorological to agricultural drought propagation time analysis and driving factors recognition considering time‑variant characteristics. Water Resources Management. 38(3):991-1010. https://doi.org/10.1007/s11269-023-03705-8.