https://doi.org/10.29312/remexca.v17i4.4097

elocation-id: elocation-id: e4097

Pérez-Paredes, López-Canteñs, Arteaga-Ramírez, Romantchik-Kriuchkova, Olguín-Rojas, and Ontiveros-Capurata: Development of a thermal camera for RPAS used to monitor the water status of crops

Journal Metadata

Journal Identifier: remexca [journal-id-type=publisher-id]

Journal Title Group

Journal Title (Full): Revista mexicana de ciencias agrícolas

Abbreviated Journal Title: Rev. Mex. Cienc. Agríc [abbrev-type=publisher]

ISSN: 2007-0934 [pub-type=ppub]

Publisher

Publisher’s Name: Instituto Nacional de Investigaciones Forestales, Agrícolas y Pecuarias

Article Metadata

Article Identifier: 10.29312/remexca.v17i4.4097 [pub-id-type=doi]

Article Grouping Data

Subject Group [subj-group-type=heading]

Subject Grouping Name: Article

Title Group

Article Title: Development of a thermal camera for RPAS used to monitor the water status of crops

Contributor Group

Contributor [contrib-type=author]

Name of Person [name-style=western]

Surname: Pérez-Paredes

Given (First) Names: Juan José

X (cross) Reference: 1 [ref-type=aff; rid=aff1]

Contributor [contrib-type=author]

Name of Person [name-style=western]

Surname: López-Canteñs

Given (First) Names: Gilberto de Jesús

X (cross) Reference: 1 [ref-type=aff; rid=aff1]

X (cross) Reference: § [ref-type=corresp; rid=c1]

Contributor [contrib-type=author]

Name of Person [name-style=western]

Surname: Arteaga-Ramírez

Given (First) Names: Ramón

X (cross) Reference: 1 [ref-type=aff; rid=aff1]

Contributor [contrib-type=author]

Name of Person [name-style=western]

Surname: Romantchik-Kriuchkova

Given (First) Names: Eugenio

X (cross) Reference: 1 [ref-type=aff; rid=aff1]

Contributor [contrib-type=author]

Name of Person [name-style=western]

Surname: Olguín-Rojas

Given (First) Names: Juan Carlos

X (cross) Reference: 1 [ref-type=aff; rid=aff1]

Contributor [contrib-type=author]

Name of Person [name-style=western]

Surname: Ontiveros-Capurata

Given (First) Names: Ronald Ernesto

X (cross) Reference: 2 [ref-type=aff; rid=aff2]

Affiliation [id=aff1]

Label (of an Equation, Figure, Reference, etc.): 1

Institution Name: in an Address: Posgrado en Ingeniería Agrícola y Uso Integral del Agua-Universidad Autónoma Chapingo. Carretera México-Texcoco km 38.5, Chapingo, Estado de México, México. CP. 56230. [content-type=original]

Institution Name: in an Address: Universidad Autónoma Chapingo [content-type=normalized]

Institution Name: in an Address: Universidad Autónoma Chapingo [content-type=orgname]

Institution Name: in an Address: Posgrado en Ingeniería Agrícola y Uso Integral del Agua [content-type=orgdiv1]

Address Line

City: Chapingo

State or Province: Estado de México

Postal Code: 56230

Country: in an Address: México [country=MX]

Email Address: josjan-@hotmail.com

Email Address: eugenio.romantchik@gmail.com

Email Address: rarteagar@chapingo.mx

Affiliation [id=aff2]

Label (of an Equation, Figure, Reference, etc.): 2

Institution Name: in an Address: Instituto Mexicano de Tecnología del Agua. Paseo Cuauhnáhuac 8532, Colonia Progreso, Jiutepec, Morelos, México. CP. 62550. [content-type=original]

Institution Name: in an Address: Instituto Mexicano de Tecnología del Agua [content-type=normalized]

Institution Name: in an Address: Instituto Mexicano de Tecnología del Agua [content-type=orgname]

Address Line

City: Jiutepec

State or Province: Morelos

Postal Code: 62550

Country: in an Address: México [country=MX]

Email Address: ronald.ontiveros@posgrado.imta.edu.mx

Author Note Group

Correspondence Information: [§] Autor para correspondencia: alelopez10@hotmail.com . [id=c1]

Publication Date [date-type=pub; publication-format=electronic]

Day: 08

Month: 07

Year: 2026

Publication Date [date-type=collection; publication-format=electronic]

Year: 2026

Volume Number: 17

Issue Number: 4

Electronic Location Identifier: e4097

History: Document History

Date [date-type=received]

Day: 01

Month: 03

Year: 2026

Date [date-type=accepted]

Day: 01

Month: 05

Year: 2026

Permissions

License Information [license-type=open-access; xlink:href=https://creativecommons.org/licenses/by-nc/4.0/; xml:lang=es]

Este es un artículo publicado en acceso abierto bajo una licencia Creative Commons

Abstract

Title: Abstract

Monitoring and evaluating crop water status is critical to optimizing water use and promoting sustainable agricultural production. The measurement of canopy temperature using thermal images has established itself as a reliable technique for estimating plant water status; however, its adoption is limited by the high cost of thermal cameras and unmanned aerial systems. Due to the above, a low-cost thermal camera was developed based on the 32 × 24 pixel MLX90640 infrared sensor and the Teensy 3.6 microcontroller, with storage capacity on a microSD card. The device was integrated into an unmanned aerial system and evaluated in a corn crop, with its measurements compared with those of a LI-COR LI-1600 porometer (accuracy ±0.5 °C). The thermal images were enhanced by bicubic interpolation and fused with RGB images to obtain images with a resolution of 640 × 480 pixels, which were then processed and segmented using binary images to isolate the pixels corresponding to the crop canopy temperature. Subsequently, the temperature values from the thermal images and the LI-COR LI-1600 porometer at each sampling site were compared, yielding a root mean square error of 0.74 °C. The results show that the developed thermal camera offers adequate accuracy, low cost (135 USD), and high spatial representativeness, positioning itself as a promising tool for thermal canopy monitoring in precision agriculture and efficient water resource management applications.

Keyword Group [xml:lang=en]

Title: Keywords:

Keyword: canopy temperature

Keyword: infrared sensors

Keyword: RPAS

Keyword: thermal camera

Keyword: water stress

Counts

Figure Count [count=9]

Table Count [count=1]

Equation Count [count=3]

Reference Count [count=23]

Abstract

Monitoring and evaluating crop water status is critical to optimizing water use and promoting sustainable agricultural production. The measurement of canopy temperature using thermal images has established itself as a reliable technique for estimating plant water status; however, its adoption is limited by the high cost of thermal cameras and unmanned aerial systems. Due to the above, a low-cost thermal camera was developed based on the 32 × 24 pixel MLX90640 infrared sensor and the Teensy 3.6 microcontroller, with storage capacity on a microSD card. The device was integrated into an unmanned aerial system and evaluated in a corn crop, with its measurements compared with those of a LI-COR LI-1600 porometer (accuracy ±0.5 °C). The thermal images were enhanced by bicubic interpolation and fused with RGB images to obtain images with a resolution of 640 × 480 pixels, which were then processed and segmented using binary images to isolate the pixels corresponding to the crop canopy temperature. Subsequently, the temperature values from the thermal images and the LI-COR LI-1600 porometer at each sampling site were compared, yielding a root mean square error of 0.74 °C. The results show that the developed thermal camera offers adequate accuracy, low cost (135 USD), and high spatial representativeness, positioning itself as a promising tool for thermal canopy monitoring in precision agriculture and efficient water resource management applications.

Keywords:

canopy temperature, infrared sensors, RPAS, thermal camera, water stress.

Introduction

Monitoring crop water status is essential to maintain productivity and quality; as reliable indicators of water stress, they not only describe the availability of water in plants but also allow predicting the effects of deficit irrigation on yield ( Noguera et al ., 2020 ; Abioye et al ., 2022 ; Jiménez et al ., 2022 ).

It is necessary to optimize and improve techniques for recognizing water stress that support precision irrigation management, thereby reducing production damage and yield loss ( Bijanzadeh et al ., 2022 ; Bwambale et al ., 2022 ; Melo et al ., 2022 ).

In this context, studies have shown that plant canopy temperature can be used to detect moderate to severe levels of water stress in crops ( García-Tejero et al ., 2018 ; Gheysari et al ., 2021 ; Bo et al ., 2023 ).

The relationship between leaf temperature and stomatal regulation establishes that, when a crop has an adequate water supply, stomatal conductance increases and leaf transpiration improves, thereby generating a decrease in temperature due to cooling by water evaporation, since the temperature decreases as water is lost through the stomata ( Gheysari et al ., 2021 ; Ouma et al ., 2024 ).

On the other hand, plants with a water deficit reduce the stomatal conductance of the leaf and the transpiration rate; consequently, the canopy temperature increases, since there is no heat dissipation by evaporation, thereby altering the plant’s energy balance ( Sagan et al ., 2019 ; Noguera et al ., 2020 ).

Therefore, the temperature of transpiring leaves should be close to the air temperature, whereas in the case of stressed leaves, it should be higher. This is the assumption that allows estimating water stress from canopy temperature ( López-López et al ., 2009 ; Bijanzadeh et al ., 2022 ).

Obtaining infrared radiometric images is a valuable tool in remote sensing applications for precision agriculture, as it enables irrigation monitoring, assessment of crop physiological status, and yield estimation. In this context, non-radiometric, uncooled, and low-cost IR cameras have emerged as viable alternatives for new implementations in agricultural management ( Gomes et al ., 2017 ; Dong et al ., 2023 ; Paciolla et al ., 2025 ).

Infrared cameras allow subtle changes in canopy temperature to be measured using the longwave radiation emitted ( Sagan et al ., 2019 ; Yun et al ., 2024 ). Their implementation on unmanned aerial vehicles (RPAS) makes it possible to obtain high-resolution spatial and temporal maps ( García-Tejero et al ., 2018 ; Wu et al ., 2023 ). This allows us to more precisely understand the variability in water and physiological conditions of crops, as well as in soil characteristics ( Wu et al ., 2023 ; Oz et al ., 2025 ).

In this context, the present work aims to develop a low-cost thermal camera based on a Teensy 3.6 development board and a 768-pixel MLX90640 infrared sensor to monitor canopy temperature, which is used to determine water stress in agricultural crops, with an accuracy comparable to commercial reference instruments.

The system was integrated into an RPAS platform to obtain georeferenced information on canopy temperature and assess crop water status, thereby providing an accessible tool for precision irrigation management.

Materials and methods

Device description

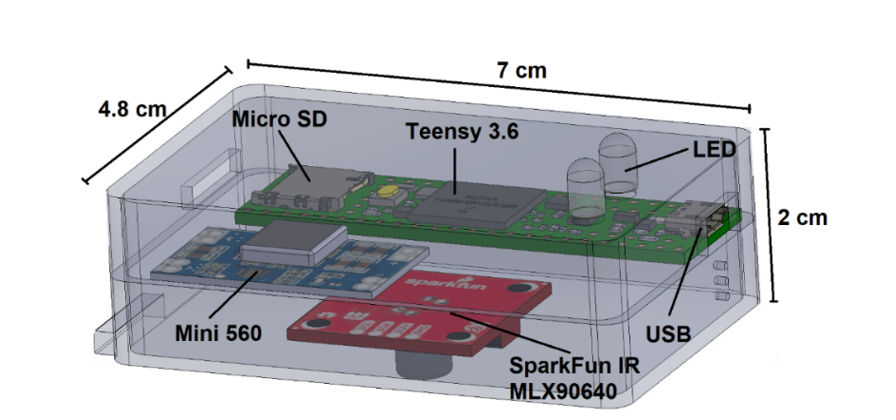
A low-cost thermal camera device was developed to measure canopy temperature in agricultural crops and to monitor water status ( Figure 1 ).

Figure 1

Figure 1. Thermal camera components.

2007-0934-remexca-17-4-e4097-gf1.png

The system is based on an MLX90640 infrared sensor (Melexis, Ieper, Belgium), integrated into a SparkFun development board (SparkFun Electronics, Niwot, Colorado, USA); the sensor consists of a 32 × 24 pixel thermal matrix that allows surface temperature information to be obtained from the thermal radiation emitted by the objects as a function of their emissivity.

The MLX90640 infrared sensor is an electronic transducer-type thermopile that converts thermal energy into an electrical signal, operating on the principle that all bodies emit thermal radiation in the far-infrared region ( Elsayed et al ., 2017 ; Paciolla et al ., 2025 ). It is capable of taking non-contact remote temperature measurements with 16-bit resolution and an operating range of -40-85 °C, considered suitable for agricultural applications.

For data processing, the Teensy 3.6 development board was used, which is equipped with a 32-bit 180 MHz processor, digital pins with interrupt capability and 3.3 V tolerance, and USB connectivity. The microcontroller was programmed in the Arduino IDE environment using the ‘Teensyduino’ plugin, which enabled us to calculate the values corresponding to the 768 pixels of the MLX90640 sensor and store the temperature information on a microSD card, taking advantage of the board’s built-in socket.

Electronic circuit diagram

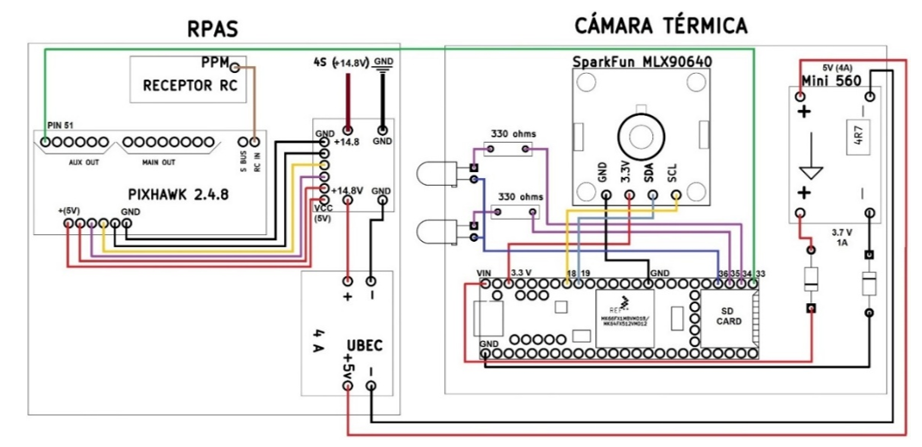
The electronic circuit was designed to ensure a proper power supply and operation of the thermal camera, complying with the voltage and current consumption requirements of the devices used: Teensy 3.6 development board (100 mA), MLX90640 sensor (23 mA) and light-emitting diodes (LEDs, 10 mA).

The electronic diagram ( Figure 2 ) shows the power supply and operation of the system, which has a four cell LiPo battery with a nominal voltage of 14.8 V and 4 000 mAh, responsible for supplying power to the flight controller. The battery voltage is regulated by a universal battery eliminator circuit that provides a 5 V output with a capacity of up to 4 A.

Figure 2

Figure 2. Schematic diagram of the connection of all components.

2007-0934-remexca-17-4-e4097-gf2.png

The thermal camera system integrates a Mini560 regulator, which reduces the input voltage from 5 V to 3.7 V with a maximum current of 1 A, to power the Teensy 3.6. Additionally, 1N4007 diodes were implemented at the output in order to protect the circuit against current spikes and reverse voltages and to reduce the electrical noise present in the main signal.

Programming the Teensy 3.6 microcontroller

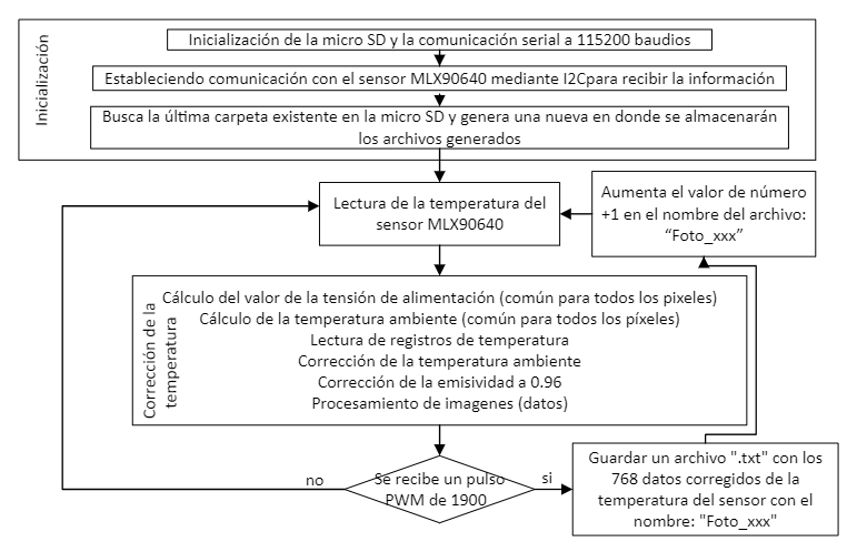
The program used on the device’s controller board was developed in the Arduino IDE environment (version 1.8.12). Figure 3 illustrates the complete routine, detailing the functions performed by the Teensy 3.6 microcontroller and the MLX90640 sensor.

Figure 3

Figure 3. Thermal camera operating diagram.

2007-0934-remexca-17-4-e4097-gf3.png

The temperature data were corrected to estimate the actual values of the canopy temperature. The sensor output data were processed together with the stored calibration coefficients in order to normalize the sensor response and obtain TO (i, j) , temperature corresponding to each pixel, using the equation described in the MLX90640 sensor manual ( Melexis, 2019 ), which is presented below.

TO (i, j)= 4VIR(i,j)_COMPENSATED∝(i,j)+(Ta+273.15)4-273.15

Where: ∝(i, j) = sensitivity coefficient of each pixel calculated from the data stored in the EEPROM; Ta = correction for ambient temperature; VIR(i,j)_COMPENSATED = noise-free compensated IR signal.

Ambient temperature correction:

Ta= -KT1+K2T1-4KT2(VTH25-PTAT_data)2KT2+25

Where: KT1 , KT2 , and VTH = constants (set during factory calibration) stored in the MLX90640’s EEPROM (defined by the manufacturer); PTAT_data = value measured by the on-chip temperature sensor.

Emissivity correction: it was set to 0.98 because this value has been reported to induce errors below 1 °C when measuring the vegetation cover of different horticultural crops ( Noguera et al ., 2020 ).

VIR(i,j)_COMPENSATED= VIR(i,j)_TGC_COMPε

Where: ε = emissivity; VIR(i,j)_TGC_COMP = thermal value of the pixel after the sensitivity compensation process and the pixel set, as described in the MLX90640 data sheet.

Remote piloted aircraft system (RPAS) mounting and capture configuration

This study employed a quadcopter-type RPAS equipped with a Pixhawk 2.4.8 flight controller, which enables the execution of autonomous flights to acquire GPS-georeferenced images. The thermal camera was mounted at the front of the aerial vehicle ( Figure 4 ), accompanied by an RGB camera, to obtain complementary information about the crop’s state.

Figure 4

Figure 4. a) Top view; and b) bottom view of the camera mounted on the RPAS.

2007-0934-remexca-17-4-e4097-gf4.png

Thermal camera evaluation

To evaluate the thermal camera, 18 flights were carried out between July and September 2024, between 12:00 am and 2:30 pm, in three plots planted with corn with an area of 0.8 ha each ( Figure 5 ), in the ‘Ranchito’ experimental field of the Chapingo Autonomous University (UACH, by its Spanish acronym), in Texcoco, State of Mexico, located at the coordinates: 19° 49’ 72” north latitude and -98° 85’ 72” west longitude.

Figure 5

Figure 5. Study area of the photogrammetric data with RPAS.

2007-0934-remexca-17-4-e4097-gf5.png

Additionally, the LI-1600 steady-state porometer (LI-COR Biosciences, Lincoln, Nebraska, USA) was used as a reference. The leaf temperature sensor is a contact thermocouple located in the clamp-type measuring chamber ( Figure 6 ), designed to be in direct contact with the foliage to record the actual leaf temperature during stomatal conductance measurement ( LI-COR, Inc., 1989 ).

Figure 6

Figure 6. Clamp-type temperature measuring chamber of the LI-1600 porometer.

2007-0934-remexca-17-4-e4097-gf6.png

The instrument was used to measure the temperature of the corn crop canopy at about 40 sampling sites per day; subsequently, the RPAS was used to acquire thermal and RGB images via autonomous flights.

Thermal image generation and segmentation of canopy temperature

Files with the ‘.txt’ extension were converted to images in TIF format using a script developed in C++ and run in MATLAB ( MathWorks, 2021 ). This procedure allowed us to process folders containing ‘.txt’ files with 768 temperature data points each, generating thermal images of 32 × 24 pixels. The images were georeferenced using GPS coordinates corresponding to the flight plan waypoints.

Additionally, RGB images were acquired using a Firefly 8S wide-angle (90°) camera in order to complement the thermal information and allow direct comparison. Furthermore, to optimize spatial resolution, the initial thermal images were subjected to a bicubic and nearest-neighbor interpolation process to increase the resolution to 640 × 480 pixels.

Fused image generation

A final image was generated by merging information from the enhanced thermal image with the luminance of the Y-channel of the YCbCr color space, transformed from the RGB image. This process was applied in a differentiated way according to the classification of each region.

Regions corresponding to the foliage: luminance modulated the temperature range assigned to the plant, allowing the radiometric variability captured by the thermal camera to be preserved.

Regions correspond to the soil: the thermal range of this category was used directly.

This procedure enabled us to efficiently integrate radiometric information from the thermal camera with the structural contrast provided by the RGB images, ensuring a more reliable and accurate estimate of the corn crop’s canopy temperature and a clear differentiation between crop and soil values.

From the new thermal-RGB fused images, segmentation of pixels corresponding to the crop canopy was performed in order to isolate areas associated with leaf temperature. The values obtained were extracted and analyzed for each image of the corn plants in which direct temperature measurements were taken with the LI-COR LI-1600 sensor, in order to establish a comparison between the two data sets.

Results and discussion

Characterization of the thermal camera developed

The circuit supplied a stable current of 1A and a voltage of 5V, incorporating protections against reverse currents and voltage spikes to protect the microcontroller and sensor. The microcontroller programming allowed the system, in the event of a PWM pulse greater than 1600 μs, to automatically save the temperature data of the 768 pixels in ‘.txt’ files, which were stored on the microSD in sequentially numbered folders, with an orderly record and without overwriting.

The spatial resolution values (GSD) obtained for different flight heights, with the sensor’s viewing angle (55° × 35°), are presented in Table 1 . The results show that as flight height increases, the size of the pixel projected onto the surface increases and the spatial resolution of the image decreases. This relationship allows the appropriate flight height to be determined based on the level of detail required for canopy temperature analysis.

Table 1

Table 1. Thermal camera resolution.

Height (m) Length / (m) Width / (m) Length pixel (cm) Width pixel (cm) Area (cm2) GSD / (cm pixel-1)
10 10.4 6.3 32.5 26.3 854.9 29.4
15 15.6 9.5 48.8 39.4 1923.4 44.1
20 20.8 12.6 65.1 52.5 3419.5 58.8

The cost of the device’s materials is 135 USD (only considering the electronic components); the device has a significantly lower value than commercial thermal cameras with similar specifications. For example, the FLIR ONE Edge Pro, designed for drones and with a resolution of 60 × 60 pixels, costs approximately 450 USD, while the FLIR Vue Pro R, with a resolution of 640 × 512 pixels, costs close to 5 000 USD ( Noguera et al ., 2020 ).

Thermal images

The MLX90640 sensor generated thermal images with reliable temperature values for the crop. Bicubic interpolation and nearest-neighbor interpolation improved the resolution from 32 × 24 to 640 × 480 pixels ( Figure 7 ). This procedure improved visual quality and facilitated the fusion of thermal images and RGB images, integrating structural information and improving the spatial interpretation of the data.

Figure 7

Figure 7. a) RGB image; b) false-color thermal image; and c) false-color interpolated thermal image.

2007-0934-remexca-17-4-e4097-gf7.png

The fusion of the enhanced thermal image and the luminance of the Y-channel of the YCbCr color space, obtained from the RGB image, allowed us to generate an image with higher radiometric and structural quality ( Figure 8 ). This procedure preserved the radiometric information of the corn foliage, enabling more accurate segmentation of the canopy and soil temperature.

Figure 8

Figure 8. False-color fused thermal image.

2007-0934-remexca-17-4-e4097-gf8.png

In addition, converting RGB images to the YCbCr color space and applying Otsu’s adaptive method to the Cr channel achieved effective separation between canopy and soil. The optimized mask eliminated noise and generated consistent segmentations in the analyzed images. These results coincide with those reported by Kamath et al . (2022) , who highlight the usefulness of the Cr channel for discriminating background vegetation in plants.

With the average temperature values of the 25 pixels segmented in the fused thermal images, where measurements were also taken with the LI-COR LI-1600 porometer, the root mean square error (RMSE= 0.74 °C) and the mean absolute error (MAE= 0.57 °C) between the two measurements were calculated, which confirms the consistency of the data obtained between both methods; likewise, a comparative temperature graph was prepared ( Figure 9 ).

Figure 9

Figure 9. Temperatures obtained with thermal images and with the Licor LI-600 porometer.

2007-0934-remexca-17-4-e4097-gf9.png

The highest difference values (∆T> 1.4 °C) were recorded on dates of September 15, 2024 (1.6 °C) and July 20, 2024 (1.48 °C), which are associated with environmental variations recorded during the measurements, such as changes in incident radiation due to cloudiness, which influence the temperature of the canopy.

In contrast, July 19, 2024 (0.11 °C), July 24, 2024 (0.07 °C), August 23, 2024 (0.11 °C), and August 10, 2024 (0.01 °C) presented the smallest differences between the two methods, reflecting stable atmospheric conditions and uniform solar radiation during sampling.

Overall, the average canopy temperatures recorded were 27.71 °C for the LI-COR LI-1600 porometer and 27.2 °C for thermal images. The maximum values were 30.73 and 31.92 °C, respectively, while the minimum values were 24.15 and 23.09 °C, respectively.

Conclusions

A thermal camera was developed using the Teensy 3.6 board and the MLX90640 infrared sensor with 768 pixels, suitable for integration into RPAS platforms to monitor canopy temperature of agricultural crops. The device’s total weight of 50 g makes it a lightweight and versatile alternative; therefore, it was a suitable solution for implementation in small and medium-sized RPAS without significantly affecting flight autonomy.

The implemented methodology enabled us to obtain georeferenced thermal images and their fusion using super-resolution with RGB information significantly improved spatial resolution and facilitated accurate segmentation of areas of interest. A high level of reliability was demonstrated when compared with the LI-COR LI-1600 porometer, obtaining an RMSE= 0.74 °C and a MAE= 0.57 °C, which supports its accuracy in estimating leaf temperature in the corn crop.

Overall, the thermal camera for RPAS presents an optimal relationship between resolution, weight, cost and size, consolidating itself as an accessible, efficient, and scalable tool for the acquisition of thermal information in precision agriculture and as a viable alternative for the measurement of canopy temperature in agricultural crops, used in the evaluation of water stress.

Bibliography

1 

Abioye, E. A.; Hensel, O.; Esau, T. J.; Elijah, O.; Abidin, M. S. Z.; Ayobami, A. S.; Yerima, O. and Nasirahmadi, A. 2022. Precision Irrigation management using machine learning and digital farming solutions. AgriEngineering. 4(1)70-103. https://doi.org/10.3390/agriengineering4010006.

2 

Bijanzadeh, E.; Moosavi, S. M. and Bahadori, F. 2022. Quantifying water stress of safflower ( Carthamus tinctorius L.) cultivars by crop water stress index under different irrigation regimes. Heliyon. 8(3):1-20. https://doi.org/10.1016/j.heliyon.2022.e09010.

3 

Bo, L.; Guan, H.; and Mao, X. 2023. Diagnosing crop water status based on canopy temperature as a function of film mulching and deficit irrigation. Field Crops Research, 304(1):1-10. https://doi.org/10.1016/j.fcr.2023.109154.

4 

Bwambale, E.; Abagale, F. K. and Anornu, G. K. 2022. Smart irrigation monitoring and control strategies for improving water use efficiency in precision agriculture: a review. Agricultural Water Management. 260(1):1-12. Elsevier B. V. https://doi.org/10.1016/j.agwat.2021.107324.

5 

Dong, M.; Shen, H.; Jia, P.; Sun, Y.; Liang, C.; Zhang, F. and Hou, J. 2023. Calibration method for airborne infrared optical systems in a non-thermal equilibrium state. Sensors. 23(14):1-18. https://doi.org/10.3390/s23146326.

6 

Elsayed, S.; Elhoweity, M.; Ibrahim, H. H.; Dewir, Y. H.; Migdadi, H. M. and Schmidhalter, U. 2017. Thermal imaging and passive reflectance sensing to estimate the water status and grain yield of wheat under different irrigation regimes. Agricultural Water Management. 189(1):98-110. https://doi.org/10.1016/j.agwat.2017.05.001.

7 

García-Tejero, I. F.; Gutiérrez-Gordillo, S.; Ortega-Arévalo, C.; Iglesias-Contreras, M.; Moreno, J. M.; Souza-Ferreira, L. and Durán-Zuazo, V. H. 2018. Thermal imaging to monitor the crop-water status in almonds by using the non-water stress baselines. Scientia Horticulturae. 238(1):91-97. https://doi.org/10.1016/j.scienta.2018.04.045.

8 

Gheysari, M.; Pirnajmedin, F.; Movahedrad, H.; Majidi, M. M. and Zareian, M. J. 2021. Crop yield and irrigation water productivity of silage maize under two water stress strategies in semi-arid environment: two different pot and field experiments. Agricultural Water Management, 255(1):1-9. https://doi.org/10.1016/j.agwat.2021.106999.

9 

Gomes, K. R.; López, D.; Ortega, J. F.; Ballesteros, R.; Poblete, T. y Moreno, M. A. 2017. Calibración de cámaras térmicas no refrigeradas embarcadas en uavs para aplicaciones agronómicas. INOVAGRI International Meeting. 26(4):1-11. https://doi.org/10.7127/iv-inovagri-meeting-2017-res0240343.

10 

Jiménez, A. F.; Cárdenas, P. F. and Jiménez, F. 2022. Intelligent IoT-multiagent precision irrigation approach for improving water use efficiency in irrigation systems at farm and district scales. Computers and Electronics in Agriculture. 192(20):1-19. https://doi.org/10.1016/j.compag.2021.106635.

11 

Kamath, R.; Balachandra, M.; Vardhan, A. and Maheshwari, U. 2022. Classification of weeds of paddy fields using deep learning. ECTI Transactions on Computer and Information Technology. 16(4):365-377. https://doi.org/10.37936/ecti-cit.2022164.246857.

12 

LI-COR inc. 1989. LI-1600 steady state porometer service manual (issue 82100030). https://licor.app.boxenterprise.net/s/auoxn0ewmmka5r5inwcf.

13 

López-López, R.; Arteaga-Ramírez, R.; Vázquez-Peña, M. A.; López-Cruz, I. y Sánchez-Cohen, I. 2009. Índice de estrés hídrico como un indicador del momento de riego en cultivos agrícolas. Agricultura Técnica en México. 35(1):97-111.

14 

Melexis. 2019. MLX90640 32x24 IR array, Datasheet. https://github.com/melexis/mlx90640-.

15 

Melo, L. L. de; Melo, V. G. M. L.; Marques, P. A. A.; Frizzone, J. A.; Coelho, R. D.; Romero, R. A. F. and Barros, T. H. da S. 2022. Deep learning for identification of water deficits in sugarcane based on thermal images. Agricultural Water Management. 272(1):1-13. https://doi.org/10.1016/j.agwat.2022.107820.

16 

Noguera, M.; Millán, B.; Pérez-Paredes, J. J.; Ponce, J. M.; Aquino, A. and Andújar, J. M. 2020. A new low-cost device based on thermal infrared sensors for olive tree canopy temperature measurement and water status monitoring. Remote Sensing. 12(1):1-20. https://doi.org/10.3390/rs12040723.

17 

Ouma, G.; Wanyama, J.; Kabenge, I.; Jjagwe, J.; Diana, M. and Muyonga, J. 2024. Assessing the effect of deficit drip irrigation regimes on crop performance of eggplant. Scientia Horticulturae, 325(1):1-14. https://doi.org/10.1016/j.scienta.2023.112648.

18 

Oz, N.; Sochen, N.; Mendlovic, D. and Klapp, I. 2025. End-to-end pipeline for simultaneous temperature estimation and super resolution of low-cost uncooled infrared camera frames for precision agriculture applications. Electrical Engineering and Systems Science. 250(1):1-24. http://arxiv.org/abs/2502.13985.

19 

Paciolla, F.; Popeo, G.; Farella, A. and Pascuzzi, S. 2025. Agronomic information extraction from UAV-based thermal photogrammetry using MATLAB. Remote Sensing. 17(1)1-17. https://doi.org/10.3390/rs17152746.

20 

Sagan, V.; Maimaitijiang, M.; Sidike, P.; Eblimit, K.; Peterson, K. T.; Hartling, S.; Esposito, F.; Khanal, K.; Newcomb, M.; Pauli, D.; Ward, R.; Fritschi, F.; Shakoor, N. and Mockler, T. 2019. UAV-based high resolution thermal imaging for vegetation monitoring and plant phenotyping using ICI 8640 P, FLIR Vue Pro R 640 and thermomap cameras. Remote Sensing. 11(1)1-29. https://doi.org/10.3390/rs11030330b.
21 

Wu, Y.; Jiang, J.; Zhang, X.; Zhang, J.; Cao, Q.; Tian, Y.; Zhu, Y.; Cao, W. and Liu, X. 2023. Combining machine learning algorithms and multi-temporal temperature indices to estimate the water status of rice. Agricultural Water Management. 289(1)1-18. https://doi.org/10.1016/j.agwat.2023.108521.

22 

Yun, H.; Lo, S.; Diepenbrock, C. H.; Bailey, B. N.; and Earles, J. M. 2024. VisTA-SR: improving the accuracy and resolution of low-cost thermal imaging cameras for agriculture. Computer Vision. 240(1):1-10. http://arxiv.org/abs/2405.19413.

23 

MathWorks. 2021. MATLAB.