elocation-id: elocation-id: e3968
In Mexico, most of the coffee-growing sector consists of peasant and indigenous families, and coffee is produced on small plots. For the state of Chiapas, coffee production is the main source of income, and the state ranks first nationally in coffee production and exports, being considered competitive; however, it has dropped to 12th place internationally. Regarding income, it should be a profitable production, with profits to meet the family needs of coffee growers. The objective was to evaluate the competitiveness and comparative advantage of small coffee producers in three regions of the state of Chiapas by analyzing their costs, income, and profitability in order to generate marketing alternatives that reduce costs and improve their profits. The hypothesis is that, in coffee production, producers obtain positive net income from their traditional production tasks, which determine competitiveness for the study regions. The research project was conducted using a mixed-methods (quantitative and qualitative) approach in the 2021-2022 production cycle in three regions of the state of Chiapas: San Juan Cancuc, Ángel Albino Corzo and Sitalá, applying the policy analysis matrix. The results indicate that the three study areas are profitable and competitive and that they have a comparative advantage. Coffee production for the study areas is profitable and competitive, has a comparative advantage and can be improved by considering the political intervention towards small producers for improvements in their crops, which will have positive effects on plant yield, thereby obtaining quality products that can be better paid and strengthening coffee growers to improve the ability to market their product and encourage the expansion of the production area.
coffee farming, coffee producers, competitiveness, PAM.
Coffee is the second-most-traded product worldwide after oil and the second most consumed after water (Gómez-Posada, 2025). It was estimated that, in 2019-2020, Brazil will remain the largest producer of coffee with 58.5 million bags, followed by Vietnam (29.5 million for 2018-2019, despite a decline in production), Colombia (14.2 million in 2018-2019), Indonesia (10.2 million), Ethiopia (7.5 million), Honduras (7.45 million) and India (5.2 million) (OIC, 2018). It should be noted that Mexico has fallen and is in 12th place worldwide (Gottfried-Hesketh, 2017).
World consumption for Mexico and Central America will remain stable at 5.23 million bags (OIC, 2018). In the 2018-2019 marketing year (October-September), Mexico exported 620 600 bags of 60 kg in its equivalent of green coffee, an amount that represents a 1.1% increase compared to the previous year in the same months; exports of the product were directed to the United States (45%), Belgium (9%), Guatemala (3%), Spain (3%), Germany (3%) and others (37%) (ASERCA, 2019).
Regarding export quotas, its share in the international trade of green coffee during the 2000-2019 period maintains a decreasing trend, which is a sign of the loss of competitiveness of the Mexican crop in the foreign market, with a decline from 2000 (8.24%) to 2019 (1.7%) (Rivera, 2022).
In Mexico, half a million small producers (67.2% are municipalities with indigenous populations) maintain coffee production in order to improve production and living conditions; this activity develops a market of more than 2 million people; most of the coffee-growing sector is made up of peasant and indigenous families and is produced in small quantities (Moguel and Toledo, 1996; Laguna, 2008; Robles, 2011). It is concentrated in a few states, such as Chiapas (41%), Veracruz (24%), and Puebla (15.3%) (SIAP, 2017; CEDRSSA, 2019). In Chiapas, coffee farming is the main income-generating activity and after tourism, the second-largest source of foreign exchange earnings (500 million dollars per year) (Isaí, 2019).
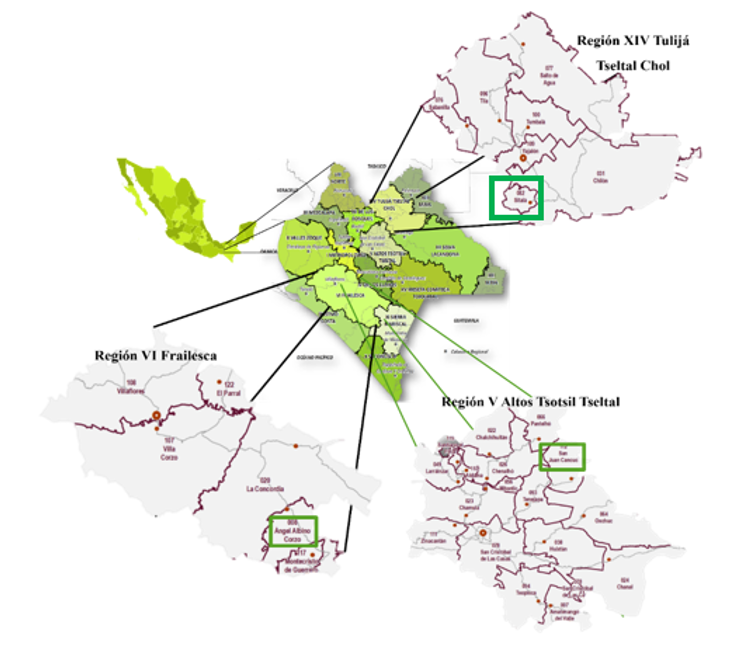
Among the coffee-producing regions of the state of Chiapas are Ángel Albino Corzo (AAC), located in region VI-Frailesca; San Juan Cancuc (SJC), located in region V-Altos Tsotsil-Tseltal; and Sitalá, located in region XIV-Tulijá Tseltal Chol (CEIEG, 2015). In AAC, 7 451 ha were planted, of which 4 730 ha were harvested and 4 635 t were obtained, with a yield of 0.98 t ha-1; for Sitalá, 2 020.75 ha were sown and 2 016.75 ha were harvested, with a production of 2 137.75 t; the average yield was 1.06 t ha-1 (SIAP, 2021). In SJC, 2 725.5 ha were planted and 2 717 ha were harvested, with a production of 2 343.2 t and a yield of 0.86 t ha-1 (SIAP, 2022).
According to production, some families harvest up to 800 kg of coffee per day, receiving a payment of 1.50 $ kg-1, which causes losses for producers because producing a quintal of green coffee costs approximately $2 292.00, of which 50% is spent on labor (Cervantes, 2017). When comparing conventional and organic production systems, the former is not profitable, and the latter has a positive benefit-cost ratio of 1.15 (López and Caamal, 2013). Coffee growers face an inequitable exchange that affects their incomes; most of them cannot even cover their production costs and many cannot make a living for themselves and their families (OIC, 2016; CEDERSSA, 2019). Low coffee prices have affected marketing channels, yet production is maintained through the overexploitation of family labor (Alvarado et al., 2006; Juárez and Ramírez, 2007).
The research aimed to evaluate the competitiveness and comparative advantage of small coffee producers in three regions of the state of Chiapas by analyzing their costs, income, and profitability in order to generate marketing alternatives that reduce costs and improve their profits. The hypothesis is as follows: in coffee production, producers obtain positive net income from their traditional production tasks, which determine competitiveness for the study regions.
The research project was conducted using a mixed-methods approach: quantitative and qualitative methods (Hernández-Sampieri et al., 2014). The study was conducted during the 2021-2022 production cycle in three regions of the state of Chiapas (Figure 1).
For region V-Altos Tsotsil-Tseltal, using information from coffee growers of the municipality of SJC in the localities of Atsamteel, Pocola 2, Pusilha, and Tanubilnha. In region XIV-Tulijá Tseltal Chol, from 26 localities of the municipality of Sitalá: 11 de abril, Ach Lum El suspiro, Atsamteel, Chabec lumil, Cristo Rey, El Diamante, Emiliano Zapata, Golonchan Nuevo, Golonchan Viejo, Guadalupe Jahuala, Insurgente Picoté, La Merced, Nuevo Porvenir, Paraiso Chicotanil, Picoté Pamala, Pokolna 2, Pomiltic, Pusilha, Rosario El Anhelo, San Antonio Jahuala, San Joaquín, San Juan Shucail, Santa Cruz El Recreo, Santa Cruz La Reforma, Sitala, and Tanubilha. Likewise, with producers who are members of the organization Batsil Lum Xihtalha, SPR de RL (composed of 272 coffee producers, with 169 active members in 2022), located in Sitalá. Region VI-Frailesca, with producers from the locality and municipality of AAC.
Data were obtained using the qualitative research technique: key informants (Taylor and Bogdan, 1987). In the case of SJC and Sitalá, a representative of each locality was appointed to facilitate communication and information (their mother tongue is Tzeltal). The same situation occurred for AAC; in this case, due to problems with COVID-19 (avoiding gatherings) and insecurity in the area, we worked with a representative of a coffee-growing family (20 coffee producers), who agreed to provide information. In the three study regions, the activities carried out in coffee plantations and post-harvest follow the traditional production system, incorporating agroecological activities to obtain quality coffee free of chemical contaminants, which generates greater commercial value.
In the policy analysis matrix (PAM), the methodology developed by Monke and Pearson (1989) is useful for setting policies for an agro-productive system; based on the calculation of a series of indicators, they determine the situation of competitiveness, protection and subsidy (Charpentier and Mora, 1999; Salcedo-Baca, 2007). The following indicators were estimated.
Private profitability: it determines the private cost ratio (PCR) or private competitiveness of a crop according to the following equation:
Where: (A-B)= private added value (PAV).
Social pricing and economic budget determination: they determine economic prices (shadow prices: they aim to reflect the true economic value of goods and services without including taxes, import tariffs, quotas, price controls and other government policies). Social prices represent the opportunity cost of inputs and products to the economy.
Comparative advantage: using data from the economic budget, the domestic resource cost ratio (RCR) or comparative advantage of a crop is calculated with the following equation:
Nominal protection coefficient of the product: it measures the degree of transfer to the producer caused by trade policy and the exchange rate, using the following equation:
Where: A(Pi)= gross income valued at private or domestic prices; E(Pi*)= gross income valued at economic or parity (international) prices.
Nominal protection coefficient of inputs: it is obtained from the following equation:
Where: B= cost of the input at private prices; F= cost of the input at economic/border prices.
Effective protection coefficient: it is calculated with the following equation:
Where: PAV (private added value)= A (private income) - B (private tradable inputs); EAV (economic/social added value)= E (social income) - F (social tradable inputs).
Comparative advantage and competitiveness of crops in the face of international trade and the elimination of subsidies: it allows us to determine whether the crop is efficient and profitable, inefficient and profitable, efficient and unprofitable or inefficient and unprofitable (Table 1).
Comparative advantage and crop protection in the face of international trade and the elimination of subsidies: it is identified whether the crop is efficient and unprotected, inefficient and unprotected, efficient and protected or inefficient and protected (Table 1).
Subsidy ratio: it is obtained from the following equation:
Where: D= domestic price; H= import/export parity price; E= parity price.
Subsidy equivalent to the producer: it represents the net policy transfer on total gross income at private prices and is obtained with the following equation:
Where: D= income at private (or domestic) prices; H= cost of tradable inputs at private prices; L= net value of the subsidy (transfer); A= added value at private prices.
Subsidy ratio to the producer’s profit: it generates results on the proportion in which private profits exceed economic profits and is obtained by the following equation:
Where: (A-B-C= D)= private profit or profitability; A= gross income at private prices; B= costs of tradable inputs at private prices; C= real net profit of the producer under the current policy scheme; (E-F-G= H)= social profit (social/economic profitability); E= gross income at social prices: F= costs of tradable inputs at social prices; G= internal factor costs at social prices; H= profit that the system would obtain in the absence of policy distortions.
Sensitivity analysis allows us to determine whether the categories of comparative advantage are sensitive to changes in individual parameters. Likewise, it enables us to identify whether the ordering of comparative advantages can change if technical coefficients and social prices differ from expectations. The parameters to be examined are: 1) world reference prices of products; 2) yields; and 3) the exchange rate.
Tradable inputs: the highest expenditures were in AAC, followed by SJC and Sitalá (Table 2).
Table 3 shows that the costs of tradable inputs, such as fertilizers, in SJC represented 1.62% (some producers used worm humus). In AAC, they apply organic fertilizer donated by the coffee-growing organization (6.57%). Sitalá does not use fertilizers.
Fungicides were used only in AAC and represented 0.83%; they are applied at the nursery stage as a preventive measure, mainly against coffee rust (Hemileia vastatrix L.). Insecticides (based on garlic, chili or onion, mixed or alone in a fermentation process to obtain an extract) in the three zones accounted for 0.68% (SJC), 0.32% (Sitalá) and 0.17% (AAC), respectively.
The cost of using the rooting agent was 7.04% for the SJC area and 0.76% for the AAC area. The acquisition of seeds or plants accounted for 86.11% in SJC, 95.19% in Sitalá (the producers themselves selected their seeds or (germinated) plants from the same plot) and 77.91% in AAC because they bought certified seed, ensured 95% germination and improved plant quality.
As for the contracted services, the transport of coffee from the producer’s plot to the final buyer’s warehouse (coffee-growing organizations) was considered. In SJC, it generated a cost of 4.52%; the cost of transportation and cargo (quintales of coffee) on the SJC-Sitalá route is calculated. For Sitalá, the expense was 3.9%, considering the cost of public transport: motorcycle taxis (local means of transport); for AAC, the expense was 13.73% (three-tonne truck) (Table 3).
Internal factors: the largest expenditure on manual labor were in AAC and SJC (Table 2). The payment of labor (daily wages) in AAC was higher ($150.00 for an eight-hour workday) than in SJC and Sitalá ($70.00 for an eight-hour workday). In coffee farming, the use of family labor depends on the number of hectares owned by the producer and on production, which varies across the three harvest stages, being lower in the late harvest (Vázquez-López et al., 2022). The land used in coffee production (annual cost of 10 000.00 $ ha-1) and plant production (nursery) is the second generator of expenses for the three zones: it was $10 276.82 (33.57%) for SJC, $10 197.63 (42.57%) for Sitalá and $10 186.47 (31.99%) for AAC. As for miscellaneous materials, SJC spent $4 007.45 (13.09%), Sitalá spent $4 239.43 (17.69%) and AAC spent $4 125.94 (12.95%); the latter uses more tools. The use of water (natural tributaries or wells) and electricity incurred no costs.
Indirectly tradable inputs: the pulping machine was considered, with costs of $10 981.65 for AAC, and $9 549.30 for SCJ and Sitalá, costs that were divided by the 15 years of useful life (Table 2).
Total income: the zone with the highest total income was SJC, followed by AAC and Sitalá (Table 2). In AAC, income increased because the organization granted its members support [social premium and inputs (organic fertilizer) for the nutrition of their crops]. The organization of producers enables better positioning of their products in the market and access to collective agricultural programs (Morales et al., 2022).
Net profits: when subtracting total costs, including land, from total income (SJC= $37 789.36, Sitalá= $29 630.10 and AAC= $39 307.34), Sitalá obtained higher net profits, followed by SJC and AAC (Table 2). When performing the calculation excluding the cost of land, profits of $15 435.02 (Sitalá), $12 260.50 (SJC) and $10 468.95 (AAC) were obtained.
The economic budget data are presented and analyzed (Table 4).
[i] TI= total income; TCil= total costs including land; NPil= total net profits including land; ITI= indirectly tradable inputs; PE= policy effects; GI= gross income; TE= total effect; EPC= effective protection coefficient; PCR= private cost ratio or competitiveness; RCRIoCA= domestic resource cost ratio or comparative advantage; SEP= subsidy equivalent to the producer; SPP= subsidy to the producer’s profit; PCR< 1= private cost ratio less than one; 0< PCR> 1= private cost ratio between zero and one; CCA= competitiveness and comparative advantage; AICP= analysis of the income from coffee production; IC= intermediate consumption; AV= added value.
Indirectly tradable inputs: When analyzing the private budget data with the economic data, there was no difference; the costs did not vary (they are equal to 1). These are costs that are not distorted by some (import) taxes that are significant for this analysis. The incentives and disincentives that may arise in production inputs do not affect producers, which may be due to the fact that producers use natural products and local materials.
Total income: the income in the economic budget (Table 4) was higher in AAC, followed by SJC and Sitalá, compared to private ones (Table 2); the increase in income was due to the inclusion of the sale price for coffee exports, which is higher than the national marketing prices. In the total costs in the economic budget, including land, they were higher in AAC, followed by SJC and Sitalá (Table 4).
Net profits including land were higher in Sitalá, followed by SJC and AAC (Table 4). When compared with the data on net profit from the private budget (Table 2), the differences were $2 840.93 for SJC, $4 356.29 for Sitalá, and $3 116.92 AAC. Without distorting policies or export barriers (efficiency conditions), small producers would receive higher incomes per hectare.
Policy effects: the quantities assigned to each item are zero; all the costs that were generated in production are local and natural, or they are products that were not considered to determine the import costs. Producers do not present transfers caused by market-distorting policies.
Gross income: for the three study regions, there was a higher transfer in AAC, followed by SJC and Sitalá (Table 4), due to the difference between private and economic prices, it was considered that all costs were the same and that there were no differences between private and economic costs. The differences in transfer were due to export costs in each region. In the economic budget, the purchase price of coffee was used as a reference ‘in the event’ that producers exported their product to the United States of America.
Total effect: the production of small producers using traditional technology and rainfed irrigation was considered. The results for the three regions are negative, with higher values in AAC, followed by SJC and Sitalá (Table 4), indicating that profits were lower than they would be under efficiency conditions.
Effective protection coefficient (EPC): the percentage was the same for SJC and Sitalá but higher for AAC (Table 4). It indicated that the impact on prices influenced by the policy discouraged or did not protect coffee crops that were not exported; if they did, the disincentives would be greater. The above resulted in the net impact of government policy, which influences prices, causing coffee to have a higher aggregate in the private price of 28.62%, lower than it would have been without the policies.
Private cost ratio or competitiveness: according to the zero-to-one valuation, the three regions had ‘high’ production efficiency; Sitalá was slightly more efficient (Table 4). The way they worked on coffee production was adequate, and they are competitive.
Regarding the domestic resource cost ratio (RCR) or Comparative Advantage, it was considered that if the values between zero and one are positive, the country has a comparative advantage, and if they are greater than one, there is no comparative advantage. In this case, the three regions had a comparative advantage at the national level (Table 4).
Social subsidy to the producer: it indicates the extent of distortion (negative values reflect a decrease in gross income) that occurs in production systems. The three coffee-growing regions presented the same negative value (Table 4).
As for the subsidy equivalent to the producer, it shows that distorting policies and market failures reduce private gross income. In this case, they were lower in SJC and Sitalá than in AAC (Table 4).
The subsidy to the producer’s profit, the percentage of social profits, was higher in AAC, followed by Sitalá and SJC (Table 4). Private profits did not exceed economic profits.
For the comparative advantage and competitiveness of coffee in international trade (PCR< 1), considering that RCR< 1 is competitive, it was higher in the Sitalá region, followed by AAC and SJC, and that 0< PCR> 1 is non-competitive, AAC had a higher value, followed by SJC and Sitalá; the three study regions presented ‘advantage’ and profitability, being higher in Sitalá, followed by SJC and AAC, a percentage that represented the rate of profit of the added value generated in production; likewise, there was comparative advantage (PCR< 1) (Table 4). In this regard, Velázquez-López et al. (2020) indicate that an increase in competitiveness is determined by the availability of domestic resources, technological changes, and international prices. This indicated that they remained competitive with traditional management. For her part, Valencia-Sandoval (2023) concludes that, despite Mexico being one of the largest coffee producers worldwide, it is not reflected in its competitiveness in the European market. This is due to multiple factors, including edaphoclimatic (climate change), phytosanitary (coffee rust), social (organization-intermediaries), and economic-financial (fluctuations in international prices).
Mexico presents a loss of competitiveness in the Mexican crop in the foreign market, with a clear decline in the period from 2000 (8.24%) to 2019 (1.7%), especially if compared to its competitors in Latin America; Mexico’s decreasing competitiveness is due to international competition concentrated in Brazil, Vietnam, Colombia, Indonesia and Honduras, and due to the emergence of new competitors; likewise, the price of coffee has suffered abrupt falls in various episodes, generating a disincentive for coffee growers not to increase their production and, consequently, generating a decrease in exports in recent years (Rivera, 2022). In this research, the results coincide with those reported by Cerquera et al. (2020), who analyze coffee competitiveness and emphasize that the coffee-growing sector is highly dependent on exports, suggesting a strong influence of the exchange rate on the decision to sell the product abroad.
Regarding the revealed comparative advantage, where the structure of the world market is compared, considering the international market as the space where the pattern of specialization is reflected, the comparative advantage in Mexico is very low; it went from 1.2 in 2012 to 0.5 in 2020 due to the high presence of manufactured products, which represent most of the exchanges between Mexico and the United States of America (Xotlanihua-Flores and Crespo-Stupková, 2024).
Effective protection coefficient: with respect to the comparative advantage and protection of coffee in international trade (PCR< 1, there is a comparative advantage; if EPC< 1, protection does exist, and if EPC> 1, it does not exist), the data indicate that the EPC (Table 4) in the three regions presented a comparative advantage and protection.
Analysis of income from coffee production: in this case, net profit (excluding land) was higher in Sitalá, followed by SJC and AAC by annual production cycle (Table 4); monthly, they were $1 021.70, $1 286.25 and $872.41 and daily (30 days a month), they were $34.05, $42.87 and $29.08. When comparing the data with the minimum wage in Mexico ($172.00-$207.00), none of the three regions reached this income.
According to the results obtained by Pérez-Vázquez et al. (2024), the annual profit in coffee production under traditional polyculture (CTP) was $27 793.69, and in the commercial polyculture coffee system (CCP), it was $46 620.31; when calculating the daily profit, it was $76.15 for the CTP system and $127.73 for the CCP system, with a B/C ratio of 0.22 for CTP and 0.53 for CCP. It can be observed that the systems were profitable, but the profit did not reach the minimum wage. In the analysis by Hernández-Aguirre et al. (2024), they indicate that the B/C ratio is 1.12 (profitable); nevertheless, when reviewing the net profits for 378 ha with 50 producers (informants) in the fifth year, where higher profits are obtained ($919 870.00), if divided among the 50 coffee growers, they obtained the following figures: annual profit of $18 397.40, monthly profit of $1 533.11, and daily profit of $50.40.
Coffee exports and prices, as well as the drop in prices, considerably affect producers’ income; the authors also argue that climate change and the little or no training of coffee growers harm seed production, and that exports do not depend directly on the existing production in each country but on international prices, the level of demand, and the exchange rate (Figueroa-Hernández et al., 2019).
Intermediate consumption: the costs derived from coffee production included the production of inputs for production (fertilizers, insecticides, fungicides, and soil disinfectants), the acquisition of seeds or plants, various materials, and labor. It represented 28.12% for SJC, 28.45% for Sitalá, and 29.29% for AAC (Table 4). The data reflect the expenditure from coffee production in other sectors of the regional economy.
Added value: the figure represented in the added value is the amount used to pay for labor, land, water, capital, and administration; it was 71.88% for SJC, 71.55% for Sitala, and 70.71% for AAC (Table 4), deducted from each region’s total income.
Coffee production in the study areas is profitable and competitive and shows a comparative advantage at the national level, with high efficiency in production under the traditional system, which strengthens competitiveness given domestic resources. Despite being profitable, net profits are below the minimum wage. The traditional production system is important for maintaining comparative advantage due to the use of local inputs and agroecological practices; however, there are other concepts (low marketing prices, transportation costs and land costs, among others) that generate higher costs and must be analyzed to reduce them and improve profitability. Given the results, it is important to work on reducing costs in the concepts that drive them up and to strengthen the organization of producers in terms of production and marketing to improve competitiveness.
Salcedo-Baca, S. 2007. Competitividad de la agricultura en América Latina y el Caribe. Matriz de análisis de política: ejercicios de cómputo. FAO. Santiago de Chile, Chile. 99 p. https://web.archive.org/web/20210428210800/https://www.cepal.org/sites/default/files/courses/files/03-3-map-manual-fao.pdf.