Revista Mexicana de Ciencias Agrícolas special publication number 26 June 15 - July 30, 2021
DOI: https://doi.org/10.29312/remexca.v0i26.2941
Article
Impact of different fertilizers on soil solution and tomato growth
Jorge Enrique Canales-Almendares1
Fernando Borrego-Escalante2
Willian Alfredo Narvaez-Ortíz1
Susana González-Morales3
Adalberto Benavides-Mendoza4§
1Ph. D. in Protected Agriculture-Antonio Narro Autonomous Agrarian University. Saltillo, Coahuila, Mexico. CP. 25315. (jorgecanales15@yahoo.es; williamnarvaezo@gmail.com). 2Plant Breeding Department-Antonio Narro Autonomous Agrarian University. Saltillo, Coahuila, Mexico. CP. 25315. (fborregoe9@gmail.com). 3CONACYT-UAAAN-Department of Horticulture. Saltillo, Coahuila, Mexico. CP. 25315. (qfb-sgm@hotmail.com). 4Department of Horticulture-Antonio Narro Autonomous Agrarian University. Road Antonio Narro no. 1923, Saltillo, Coahuila, Mexico. CP. 25315. (abenmen@gmail.com).
§Corresponding author: abenmen@gmail.com.
Abstract
Soil solution is a complex and open system that has inputs and outputs of energy, this study was carried out to determine the impact of different types of fertilizers on the composition of the soil solution and the accumulation of biomass in tomato plants. Tomato plants cultivated in greenhouse in pots with calcareous soil and forest soil were used to apply three types of fertilizers: Steiner solution, solid fertilizers and vermicompost tea. Concentrations of NO3-, K+, Ca2+, Mg2+, Na+ and SO42- in the soil solution increased over time, registering higher ion concentration values in the solid fertilizer (625, 183, 374, 70, 49 and 161 mg L-1, respectively) and in the Steiner solution (500, 177, 363, 65, 69 and 235 mg L-1). The highest concentrations of ions in the soil solution coincided with the largest accumulation of biomass, 3 938 and 4 546 g plant1 in the solid fertilizer and the Steiner solution, respectively. In contrast, in the soil solution of the vermicompost tea, except for Na+, there were lower ion concentrations (94, 63, 118, 28, 75 and 98 mg L-1) and a lower accumulation of biomass, with an average of 1 355 g plant-1. The Steiner solution and solid fertilizers treatments had the highest average yield values, with 3 637 and 2 712 g plant-1, respectively. This result indicates that the form of application and source of the fertilizer influences the soil solution.
Keywords: Solanum lycopersicum L., anions, calcisols, cations, mineral nutrition.
Reception date: January 2021
Acceptance date: April 2021
Introduction
Plants take from soil solution (SS) the nutrients necessary for their development and growth, the elements found in SS and that are in contact with the roots of the plant are influenced by many processes such as, microbial respiration, root exudes, absorption, fixation by soil particles, drainage, the amount of oxygen, temperature, soil moisture, redox processes etc. Few studies have been conducted addressing the influence of the processes mentioned above on the dynamics and composition of the SS over time, especially soils for cultivation purposes (Huang et al., 2011).
Exchange processes are often regulated by the concentration of NO3-, usually the dominant anion in SS (Plett et al., 2020). However, other elements included in fertilizers also modify the composition of SS (Narváez-Ortiz et al., 2015). Therefore, the chemical form of the fertilizer will directly and indirectly affect the chemical composition of SS and consequently, the absorption of nutrients and the growth of plants.
The study of SS allows an approach to the real state of the availability of nutriments released by fertilizers and the contents in the soil (Hernández-Díaz et al., 2014). SS is the interface between the solid phase of soil and the root cells that absorb nutrients. It is considered important to understand the dynamic conditions prevailing in SS, since changes in composition can occur quickly, especially during absorption of nutrients by plants (Narváez-Ortiz et al., 2015). The study of the chemical composition of SS can be carried out by different techniques, one of them is the placement of suction probes that allow the extraction and characterization in the laboratory or even in-site of the SS sample.
The study of the dynamic behavior of SS allows to establish an index of the availability of mineral nutrients, as well as their impact on crops (Souza et al., 2013). The soil solution is the dynamic phase that connects the use of fertilizers with leaching and adsorption in the solid phase of soil and with the absorption and growth of plants (Llanderal et al., 2019). As far as we know, the impact on different soils of different fertilizers on the composition of the soil solution has not been studied for the tomato under greenhouse. The objective of the research was to evaluate the dynamic behavior of the soil solution in two types of soil with three types of mineral or organic fertilization, and its impact on the accumulation of biomass and chemical composition of tomato plants.
Materials and methods
This research was carried out at the Antonio Narro Autonomous Agrarian University (UAAAN), in Saltillo, Mexico. Hybrid tomato plants (Solanum lycopersicum) of the Toro variety, with a determinate growth habit, were used as experimental material. After germination and care of seedlings, these were established under greenhouse during the period October-April in polyethylene pots of 12 L with two types of soil: a non-agricultural calcareous soil collected from the profile 0-0.3 m in an area without the presence of vegetation and a black forest soil collected from the profile 0-0.3 m, eliminating the surface mulch, in an area with reforestation of 20 years with Pinus halepensis. The soils were collected at the sites marked by coordinates 25° 21’ 14.87’’ north latitude and 101° 2’ 23.25’’ west longitude for the calcareous soil, and 25° 21’6.81’’ north latitude and 101° 1’ 27.69’’ west longitude for the black forest soil.
Before use in pots the soils were screened to remove stones and other materials. Likewise, the soils were characterized from the physicochemical point of view according to NOM-021-RECNAT-2000 (SEMARNAT 2002) (Table 1). The irrigation water was also analysed in order to take into account the composition of the different ions for the calculation of the fertilizer application (Table 2). The treatments began 7 days after transplantation (ddt) and consisted of three types of nutritional contribution to the soil during 22 weeks of plant growth. The three treatments are described below.
Table 1. Physicochemical properties of the soils.
Soil | pHa H2O | CE (dS m-1) | Apparent density (g cm-3) | Total carbonates (%) | N-NO3- (mg L-1) | P-Olsen (mg L-1) |
Calcareous | 8.08 | 0.9 | 1.04 | 39.8 | 23.1 | 19 |
Forest | 7.59 | 0.58 | 0.95 | 29.7 | 2.72 | 15 |
Cations interchangeable (mg L-1) | Texture | Organic matter | ||||
Ca2+ | Mg2+ | Na+ | K+ | Class | (%) | |
Calcareous | 6 536 | 714 | 107 | 296 | Loam | 0.97 |
Forest | 6 364 | 341 | 101 | 599 | Loam | 4.9 |
a= pH (1:2 water).
Treatment 1. Witness. Continuous supply of a Steiner nutrient solution (Steiner, 1961) by irrigation. From 0-40 ddt the nutrient solution was applied in concentration of 25% (500 µS cm-1) during the vegetative stage, from 41-60 ddt it was raised to 50% (1 000 µS cm-1) during the flowering stage, from 61-100 ddt it was increased to 100% (2 000 µS cm-1) during fruit mooring 60 ddt and 120% (2 400 µS cm-1) at the beginning of the harvest.
Treatment 2. Weekly supply of nutrients using solid fertilizers. The amount applied was equivalent, in terms of solid mineral elements, to that applied in treatment 1 by means of the Steiner solution.
Treatment 3. Organic supply by irrigation with a vermicompost tea of cattle origin with an CE of 2 000 µS cm-1. CE was adjusted by dilution until it equaled the CE of the Steiner solution, applied at the different stages listed for treatment 1. The composition of the vermicompost tea is shown in Table 2.
Table 2. Characteristics and concentration of elements of the irrigation water and the vermicompost tea used in the experiment.
Irrigation water | Vermicompost tea | |||
Variable | Value | Variable | Value | |
pH | 8.06 | N-NO3- | 50 mg L-1 | |
CE | 770 (µS cm-1) | P | 9.3 mg L-1 | |
N-NO3 | 4.96 mg L-1 | K+ | 440.2 mg L-1 | |
K+ | 6.24 mg L-1 | Ca2+ | 96.5 mg L-1 | |
Ca2+ Mg2+ Na+ SO4-2 HCO3- CO32- | 95.8 mg L-1 24.1 mg L-1 20.5 mg L-1 81.7 mg L-1 256 mg L-1 34.2 mg L-1 | Mg2+ Na+ SO4-2 Fe2+ Zn2+ B Cu2+ Mn2+ | 42.8 mg L-1 186 mg L-1 154.5 mg L-1 0.3 mg L-1 0.05 mg L-1 1.2 mg L-1 <0.005 mg L-1 <0.025 mg L-1 | |
To determine the temporary changes in the SS composition, 21 soil solution samples were carried out, one every week, using three repetitions for each treatment. For the characterization of SS, three suction probes were placed in each treatment. Three plants were randomly chosen in each sampling to place the probes inside the pot 15 cm deep and 10 cm from the plant. To take the SS sample, the following procedure was followed: 2 L were applied per pot, 15 minutes after the irrigation applied during the morning a suction pressure of 75 centibars was applied to the suction probe. The next day during the morning the SS sample was extracted from the probe with a syringe. The volume of the sample obtained in each probe oscillated between 20 and 30 ml.
The samples obtained were first subjected to an in situ analysis to determine: pH with a potentiometer of the brand Horiba model B-713, the electrical conductivity (CE) with an equipment of the brand Horiba model Spectrum Cardy Twin, the oxidation reduction potential (ORP) was measured with an electrode of the brand OMEGA model PHH-7011 and the nitrate concentration (NO3-) was determined with an ion-selective equipment of the brand Horiba model B-743. Subsequently, the SS samples were analyzed in the laboratory to determine the total nitrogen content (N) using the micro Kjeldahl technique (AOAC, 1980), that of P through visible spectrophotometry (AOAC, 1980), and the potassium concentration (K+), calcium (Ca2+), magnesium (Mg2+), sulfate (SO4-2), sodium (Na+) and boron (B) with an ICP-OES equipment of the brand Perkin Elmer model optima 8300.
The plants used in the experiment were placed in a density of 3 plants m-2, were kept in the greenhouse for 22 weeks after transplantation and received cultural practices such as training, pruning, monitoring and control of pests and diseases. Three samples were carried out on the plants, collecting three plants chosen at random in each treatment at 40, 60 and 90 ddt. The plants were separated into stems, leaves and roots to determine their fresh weight using a digital balance. Fresh samples were placed in labeled paper bags and dried on a dehydration stove at 70 °C for 72 hours up to a constant weight to then determine the dry weight (PS) using a digital balance.
The statistical arrangement used was completely randomized with 30 repetitions per treatment. The experimental unit was a plant in a pot, with a total of 180 plants in the experiment. The results of the mineral composition of the soil solution were presented in scatter plots against time. The data of the plant biomass were analyzed with the R software, for each of the biomass variables, a variance analysis and the Fisher’s mean test were performed with a significance value of p≤ 0.05.
Results and discussion
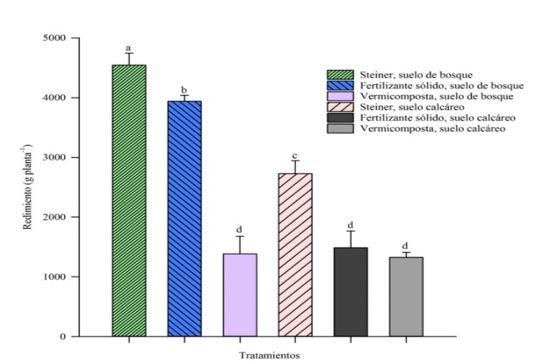
Fruit production per plant. According to the variance analysis, there were significant differences (p≤ 0.05) in the amount of fruit per plant between the different ways of applying fertilizers (Figure 1). The differences between ion concentration in SS and the biomass accumulation over time (Table 3-4) impacted fruit production (Figure 1).
Figure 1. Average yield values (g plant-1) quantified at the growing cycle for two classes of soil with different types of fertilizer application in tomato plants. Significance p≤ 0.05 DLS Fisher.
Table 3. Average concentration of elements in the soil solution for two types of soil.
Soil | T. Fertilizer | Ca2+ (mg L-1) | Mg2+ (mg L-1) | Na+ (mg L-1) | S04-2 (mg L-1) | K+ (mg L-1) | NO3- (mg L-1) |
Forest | Steiner | 363.69 | 65.08 | 69.75 | 235.9 | 177.67 | 500.9 |
Solid | 374.03 | 70.62 | 49.11 | 161.51 | 183 | 625.55 | |
Vermicompost | 118.98 | 28.39 | 73.84 | 98.63 | 63.37 | 94.51 | |
Calcareous | Steiner | 263.85 | 120.01 | 75.31 | 256.22 | 173.54 | 505.4 |
Solid | 238.99 | 97.65 | 49.14 | 143.22 | 207.61 | 698.3 | |
Compost | 45.47 | 48.57 | 64.67 | 82.811 | 65.95 | 42 |
Table 4. Accumulation of fresh and dry biomass in three samplings of plant tissue from tomato cultivation with three different fertility regimens and their statistical significance.
Soil | T. Fertilizer | Fresh biomass (g) | |||||
40 ddt | 60 ddt | 90 ddt | 40 ddt | 60 ddt | 90 ddt | ||
Forest | Steiner | 297.5 a | 978.04 a | 1181.4 a | 35.5 a | 120.2 a | 185.9 a |
Solid | 147.8 c | 490.03 bc | 631.9 bc | 21.4 b | 65.4 bc | 87.5 bc | |
Vermicompost | 82 de | 159.63 de | 210.7 d | 12.4 d | 15.09 de | 30.1 cd | |
Calcareous | Steiner | 206.3 b | 614.6 b | 886.7 b | 21 bc | 69.21 b | 106.9 b |
Solid | 89.03 d | 333.4 cd | 479.7 c | 13.16 cd | 42.34 cd | 66.7 bcd | |
Vermicompost | 32.2 e | 65.8 e | 81.6 d | 5.39 d | 8.8 e | 11.4 d | |
Significance of p≤ 0.05 DLS Fisher.
The Steiner nutrient solution and the solid fertilizer treatments for the forest soil obtained the highest values 4 546 g plant -1 and 3 938 g plant-1, while the treatment of the vermicompost tea had average values between the two soils of 1 355 g plant-1, being these the lowest in the experiment.
Hernández-Díaz et al. (2014) found significant differences in a study carried out in the reference levels of nutrients in the soil solution in a tomato cultivation under protected conditions at two times of production. These differences were present in both the concentration of ions in the soil solution and the accumulation of biomass; in the flowering stage during spring (March-June) they reported values for NO3- of 371.3 mg L-1, Ca2+ 58.2 mg L-1, K+ 123.24 mg L-1, Mg2+ 16.08 mg L-1, pH 7.23 and CE 1 300 (µS cm-1) with a total production of dry matter of 206.53 (g m-2).
The treatment with Steiner, for the two soil types, obtained the highest total of dry matter production of 557.01 (g m2), the solid treatment 303.48 (g m-2) and that of vermicompost 91.86 (g m-2), with an average yield for the Steiner treatment of 4 746.22 g plant-1, followed by the treatment with solid fertilizer of 3 994.1 g plant-1 and the treatment with vermicompost of 1 050 g plant-1 for forest soil, as for the calcareous soil the yield was lower (Figure 1).
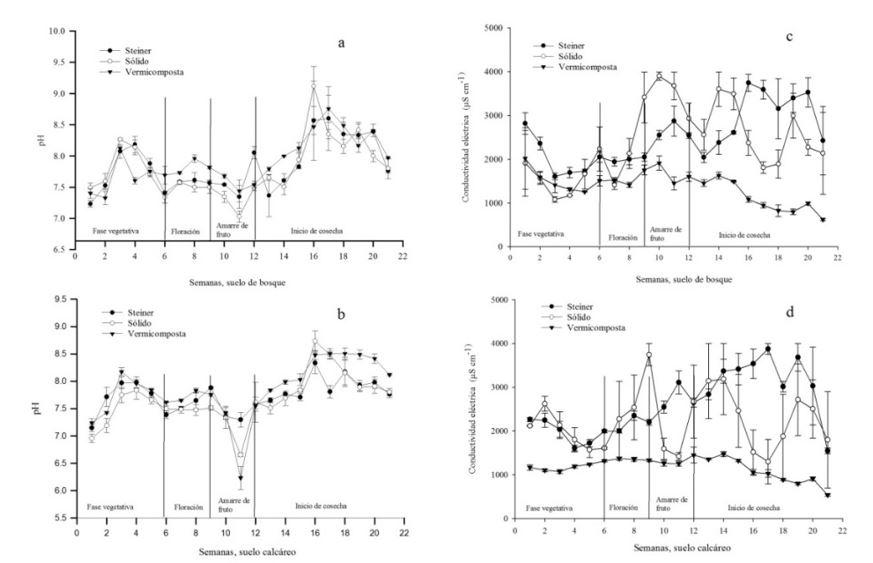
Electrical conductivity of the soil solution. From a dynamic point of view, the electrical conductivity (CE) was different for both soil classes and fertilization types (Figure 2a and 2b). During the vegetative growth phase (first 40 ddt) the largest CE was present in the Steiner solution and the solid fertilizer treatments, while the vermicompost treatment had the lowest values. The Steiner solution and the solid fertilizer, except for some samples, showed no differences between the CE values, while the vermicompost treatment showed lower values almost constantly.
Figure 2. Average values and standard error of the electrical conductivity and pH in the soil solution over time for two classes of soil with different types of fertilizer application in tomato plants. Vertical lines mark the stages of plant development.
During the reproductive stage, the CE values increased for all treatments, this regardless of the soil type, although the vermicompost treatment had the lowest values (Figure 3a and 3b). The above possibly because the contribution of organic matter modifies the ion exchange balance in the soil, resulting in a different profile of ions available, rather than a different CE (Narváez-Ortiz et al., 2015).
Figure 3. Average values and standard error of NO3- in soil solution over time for two classes of soil with different types of fertilizer application in tomato plants. Vertical lines mark the stages of plant development.
On the other hand, differences in the CE values between treatments within each type of soil probably reflect the different nutrient load in the exchange matrix (Table 2) and the resulting buffer capacity of each soil, in interaction with the different sources of fertilizers (Chenu et al., 2000), additionally, the differential metabolic work of the roots (extrusion of protons or organic acids) in each type of soil must be taken into account, factor that also induces changes in the soil composition (Broadley, 2012).
pH of the soil solution. In the calcareous soil, the pH of the soil solution had an average of 7.8 (Figure 2c and 2d ). This average was even lower than the pH observed for SS in the three treatments applied to the forest soil. Generally, for the two soils and the different treatments, the pH decreased 7.6 during the vegetative stage, and during flowering and fruit mooring 7.5, and increased 8 again when the fruit harvest arrived, with no significant differences between treatments.
The forest soil had a lower pH than the calcareous soil (Table 2), but during the experiment, the forest soil solution showed higher pH than that of the calcareous soil (Figure 2c and 2d). It is possible that this effect has depended on a greater absorption of NO3- and other ions by the root (Butterly et al., 2013).
The changes observed in the pH values between plant growth stages were surely due to changes in the plant metabolic activity, mainly the absorption of NO3-, which caused modifications in the ions exchanged with the soil solution (Broadley, 2012; Llanderal et al., 2019). On the other hand, an explanation for the little difference in the pH values between treatments is indicated by (Lao et al., 2003) who mention that the soil buffering capacity keeps pH within certain limits even using nutrient solutions of different composition. However, these authors point out that there are no differences between stages of growth of tomato plants, while in this work they did occurre, the differences were surely due to the volume of soil used, since Lao et al. (2003) conducted their study in open field, without restriction on the soil volume, while in this experiment pots were used.
Nitrate in the soil solution. The average concentration value of NO3- in the SS of the three treatments was 398.57 mg L-1, with the highest concentrations corresponding to the solid fertilizer and the Steiner treatments (average 500.92 and 640.52 mg L-1, respectively), while the vermicompost treatment averaged 54.25 mg L-1 (Figure 3a and 3b), it should be noted that the dynamic behavior of NO3- in SS in both calcareous soil and forest soil was relatively stable for the treatment of vermicompost.
The value 48.17 mg L-1 obtained for the vermicompost (Figure 4a and 4b) is a concentration below the threshold of 62 mg L-1, which is considered the minimum that induces low affinity nitrate transporters (Dechorgnat et al., 2011). In the exchange phenomena between the solution and the solid matrix of the soil, nitrate plays an important role not only as a source of N, but in the balance of loads, as it is the most abundant anion in SS; However, very high values can lead to leaching because of their high mobility, with the consequent contamination of groundwater or excessive accumulation of nitrate in plant tissues (Dechorgnat et al., 2011; Hernández-Díaz et al., 2014; Llanderal et al., 2019).
A tendency to show higher concentration values of NO3- is also notable in the harvest period, which may indicate some association between the physiological processes of the plant and the composition of SS, possibly through radical exuded (Keiluweit et al., 2015). On the other hand, a possible explanation based on the tendency to further mineralize by varying the relative content of soil water (Plettp et al., 2020) does not sound plausible, as soil water was not allowed to decrease in its availability for plants and the increased availability of nitrate is known to occur in oxic systems with soil pores with lower water volume (Alvarez and Steinbach, 2009).
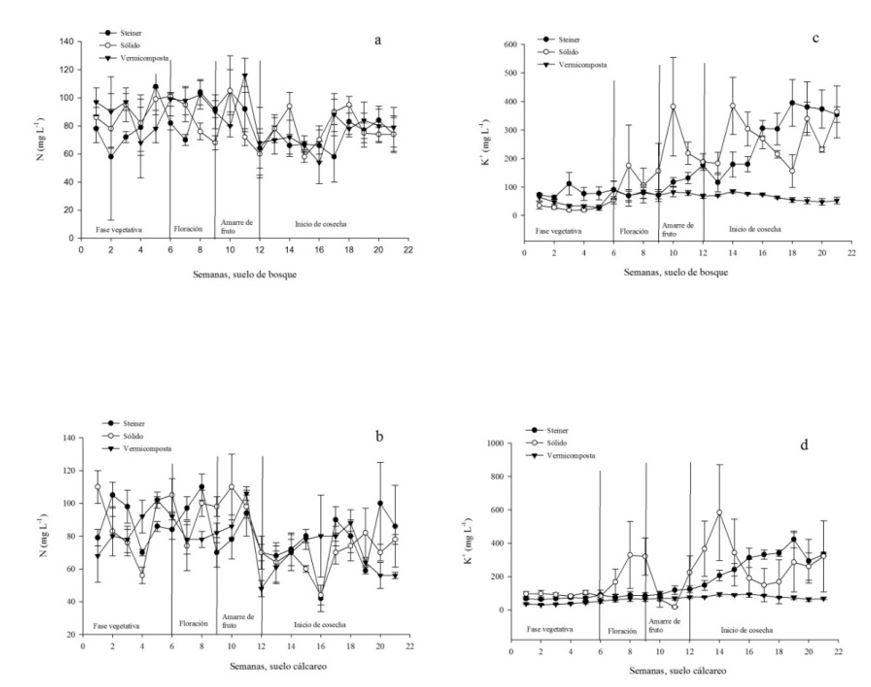
N total and K+ in the soil solution. The average values for total N in SS were 79, 81 and 79 mg L-1 for the Steiner solution treatment, solid fertilizer and vermicompost, respectively. Contrary to what was observed for NO3-, total N had a much more stable dynamic process and without significant differences between treatments in both soils (Figure 4a and 4b). It should be noted that, in both types of soil the lowest total N values occurred at the fruit harvest stage, that is, contrary to what was observed for NO3- (Figure 3).
Figure 4. Mean values and standard error of the concentration of N total and K+ in the soil solution over time for two classes of soil with different types of fertilizer application in tomato plants. Vertical lines mark the stages of plant development.
As for the concentration of K+, the average for forest soil and calcareous soil was 256 and 241 mg L-1, respectively. The dynamic behavior of K+ in SS was different for each treatment (Figure 4c and 4d).
The vermicompost treatment showed stable values, but with a small tendency to rise in the phases of flowering and filling of the fruit, showing an overall average concentration of K+ of 60 mg L-1. In contrast, the Steiner solution treatment showed a steady positive trend, reaching the highest values during fruit harvesting and presenting an overall average of 372 mg L-1 of K+. The solid fertilizer treatment reached the highest values during the harvest stage for the two types of soil and an overall average of 361 mg L-1.
The variation in the quantities of N (Figure 5a and 5b) at the different stages of the growing cycle could indicate some association between the chemical and biological processes that provide different forms of N to SS and the physiological behavior of the plant, in this case possibly the rate of exudation of metabolites by the root (Keiluweit et al., 2015) or by the increase in the rate of mineralization that occurs against the higher relative water content (Plett et al., 2020).
The treatment with solid fertilizer showed a positive trend as did the Steiner treatment in the K+ dynamics (Figure 5c and 5d) in SS, but with concentration spikes that occurred after flowering. It can be expected that the positive trend in the availability of potassium of higher relative soil water content, but the same trend should be observed in the treatment where vermicompost was applied, but that did not occur. It is then likely that the additional contribution of organic matter of the latter fertilizer modified the adsorption of K+ in the soil colloids (Yanai el al., 1997; Chenu et al., 2000; Yin el al., 2019).
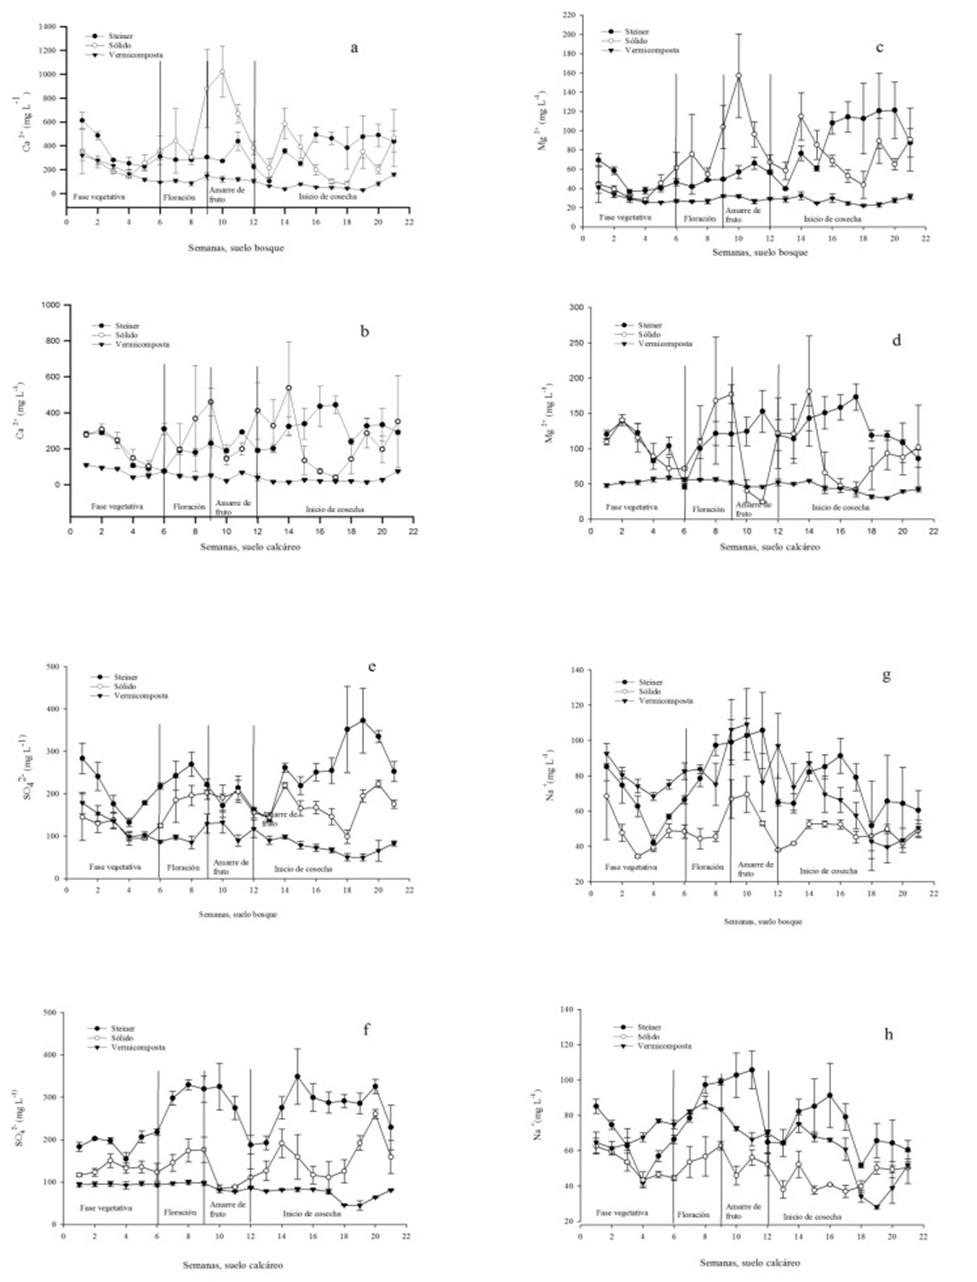
Figure 5. Mean values and standard error of the concentration of Ca2+, Mg2+, SO4-2 and Na+ in the soil solution over time for two classes of soil with different types of fertilizer application in tomato plants. Vertical lines mark the stages of plant development.
Ca2+, Mg2+, Na+ and OS4-2 in the soil solution. The average concentration values of Ca2+, Mg2+, Na+ and OS4-2 in SS for each type of soil and treatment are shown in Table 4. It should be noted that, the dynamic behavior of Ca2+ and Mg2+ (Figure 5) was similar to that shown by K+ (Figure 4). The highest values for calcium concentration were found with the application of solid fertilizer.
The highest values for calcium concentration were found with the application of solid fertilizer (Figure 5a and 5b), when comparing fluctuations in Ca2+ with those of Mg2+ it is possible to observe greater stability around the average by Mg2+, so it appears to be a behavior associated with the exchange processes of these major cations, showing Ca2+ a higher number of peaks with higher concentration and a range of variation of hundreds of mg L-1 compared to Mg2+ (Figure 5c and 5d), which showed a range of variation of tens of mg L-1, with wider variations again for solid fertilizer.
The dynamic behavior of Na+ (Figure 5g and 5h) was different from that of Ca2+ and with some resemblance to that of Mg2+, showing fluctuations and concentration peaks of tens of mg L-1, but now showing the lowest values in the solid fertilizer and the highest for the Steiner solution and the vermicompost. In the latter case the result is explained by the large amount of sodium found of origin in the fertilizer (Yanai et al., 1996; Venterink et al., 2002; Sana et al., 2013).
As for the OS4-2 values (Figure 5e and 5f), for both soils the highest were found during harvest for the Steiner treatment. A partial explanation of this fact could be the contribution of H2SO4 used for the acidification of the nutrient solution.
Accumulation of plant biomass. The average values of fresh and dry biomass accumulated for each type of soil and treatment at 40, 60 and 90 after transplantation are described in Table 4. Biomass accumulation showed significant differences (p≤ 0.05), with highest values in the Steiner and the solid fertilizer treatments, while the lowest values in vermicompost treatment.
The composition of the soil solution was affected by the growth of the plant, that is, the composition of anions and cations, as well as its concentrations showed dynamic changes dependent on the growth of the plant (Figure 1-6). This same phenomenon was reported by (Hernández-Díaz et al., 2014) in a tomate cultivation.
With an adequate supply of nutrients, fast-growing crops have a higher rate of nutrient uptake per unit of root weight, which causes differences in the absorption and exchange of ions, in turn modifying the composition of the soil solution in a differentiated way, depending on the root biomass and metabolic activity of this, this conclusion was corroborated by (Christie and Moorby, 1975), who investigated different pastures under controlled conditions in greenhouse. It is difficult to distinguish whether in fast-growing crops there is higher absorption per unit of root biomass (perhaps due to higher density of channels per unit of root area) or whether this response depends on higher root biomass per plant (Hamnér et al., 2017).
Conclusions
The dynamics of ions in the soil solution over time and the biomass accumulation, as well as their chemical composition are affected by the concentration of ions in the two types of soil with the three forms of fertilizer application, where the highest values resulted in the treatment with the Steiner solution.
Cited literature
Alvarez, R. and Steinbach, H. S. 2009. A review of the effects of tillage systems on some soil physical properties, water content, nitrate availability and crops yield in the argentine pampas. Netherlands. Soil and Tillage Res. 104(1):1-15. Doi: 10.1016/j.still.2009.02.005.
Broadley, M.; Brown, P.; Cakmak, I.; Rengel, Z. and Zhao, F. 2012. Function of nutrients: micronutrients. In Marschner's mineral nutrition of higher plants . Academic Press. 191-248 pp. Doi:10.1016/B978-0-12-384905-2.00007-8.
Butterly, C. R.; Baldock, J. A. and Tang, C. 2013. The contribution of crop residues to changes in soil pH under field conditions. Netherlands. Plant and Soil. 366(1):185-198. doi:10.1007/s11104-012-14221.
Chenu, C.; Bissonnais, Y. L. and Arrouay, D. 2000. Organic matter influence on clay wettability and soil aggregate stability. United States. Soil Sci. Soc. Am. J. 64(4):1479-1486. Doi: 10.2136/sssaj2000.6441479x.
Christie, E. K. and Moorby, J. 1975. Physiological responses of semiarid grasses. I. The influence of phosphorus supply on growth and phosphorus absorption. Australia. Australian J. Agric. Res. 26(3):423-436. Doi: 10.1071/AR9750423.
Dechorgnat, J.; Nguyen, C. T.; Armengaud, P.; Jossier, M.; Diatloff, E.; Filleur, S. and Daniel, F. 2011. From the soil to the seeds: the long journey of nitrate in plants. Great Britain. J. Exp. Bot. 62(4):1349-1359. Doi.org/10.1093/jxb/erq409.
Hamnér, K.; Weih, M.; Eriksson, J. and Kirchmann, H. 2017. Influence of nitrogen supply on macro-and micronutrient accumulation during growth of winter wheat. Netherlands. Field Crops Res. 213(2017):118-129. Doi:10.1016/j.fcr.2017.08.002.
Hermans, C.; Hammond, J. P.; White, P. J. and Verbruggen, N. 2006. How do plants respond to nutrient shortage by biomass allocation. England. Trends in Plant Science. 11(12):610-617. Doi: 10.1016/j.tplants.2006.10.007.
Hernández-Díaz, M. I.; Laffita, M. C.; Moreno-Placeres, V.; Igarza-Sánchez, A. y Ojeda-Veloz, A. 2014. Niveles referenciales de nutrientes en la solución del suelo para el diagnóstico nutricional en el cultivo protegido del tomate. Chile. Idesia (Arica). 32(2):79-88. Doi: 10.4067/S0718-34292014000200011.
Huang, P. M.; Li, Y. and Sumner, M. E. 2011. Handbook of soil sciences: properties and processes. 2a (Ed). CRC Press Taylor & Francis Group. Boca Raton. Florida. USA. 351-371 pp.
Keiluweit, M.; Bougoure, J. J.; Nico, P. S.; Pett-Ridge, J.; Weber, P. K. and Kleber, M. 2015. Mineral protection of soil carbon counteracted by root exuddtes. England. Nature Climate Change. 5(6):588-595. Doi: 10.1038/nclimate2580.
Lao, M. T.; Jiménez, S.; Eymar, E.; Fernández, E. J. and Jiménez, R. 2003. Determination of spatial variability of nutrient composition of soil solutions in greenhouses by using suction cups. United States. Communications in Soil Science and Plant Analysis. 34(5-6):865-879. Doi: 10.1081/CSS-120018980.
Llanderal, A.; García-Caparrós, P.; Contreras, J. I.; Segura, M. L. and Teresa Lao, M. 2019. Spatio-temporal variations in nutrient concentration in soil solution under greenhouse tomato. United States. J. Plant Nutr. 42(8):842-852. doi: 10.1080/ 01904167.2019.1584219.
Narváez-Ortiz, W. A.; Morales-Díaz, A. B.; Benavides-Mendoza, A. y Reyes-Valdés M. H. 2015. Dinámica de la composición de la solución del suelo en cultivos del occidente de méxico. México. Rev. Mex. Cienc. Agríc. 12(6):2383-2397.
Plett, D. C.; Ranathunge, K.; Melino, V. J.; Kuya, N.; Uga, Y. and Kronzucker, H. J. 2020. The intersection of nitrogen nutrition and water use in plants: new paths toward improved crop productivity. Great Britain. J. Exp. Bot. 71(15):4452-4468. Doi:10.1093/jxb/eraa049.
Sana, A.; Sarah, S.; Asim, M.; Almas, H. and Saamia, S. 2013. Comparative analysis of animal manure for soil conditioning. Australia. Inter. J. Agron. Plant Produc. 4(12):3360-3366.
SEMARNAT. 2000. Norma Oficial Mexicana NOM-021. Que establece las especificaciones de fertilidad, salinidad y clasificación de suelos. Registro que acompaña a las muestras desde su obtención hasta su entrega al laboratorio de pruebas y análisis.
Souza, E. R. D.; Melo, H. F. D.; Almeida, B. G. D. y de Melo, D. V. 2013. Comparação de métodos de extração da solução do solo. Brasil. Revista Brasileira de Engenharia Agrícola e Ambiental. 17(5):510-517. Doi:10.1590/S1415-43662013000500007.
Venterink, H. O.; Davidsson, T. E.; Kiehl, K. and Leonardson, L. 2002. Impact of drying and re-wetting on n, p and k dynamics in a wetland soil. Netherlands. Plant and Soil. 243(1):119-130. doi: 10.1023/A:1019993510737.
Yanai, J.; Linehan, D. J.; Robinson, D.; Young, I. M.; Hackett, C. A.; Kyuma, K. and Kosaki, T. 1996. Effects of Inorganic nitrogen application on the dynamics of the soil solution composition in the root zone of maize. Netherlands. Plant and Soil. 180(1):1-9. doi: 10.1007/BF00015405.
Yanai, J.; Kosaki, T.; Nakano, A. and Kyuma, K. 1997. Application effects of controlled‐availability fertilizer on dynamics of soil solution composition. United States. Science Society of America Journal. 61(6):1781-1786. doi: 10.2136/sssaj1997.03615995006 100060033x.
Yin, Q.; Tian, T.; Han, X.; Xu, J.; Chai, Y.; Mo, J. and Yue, M. 2019. The relationships between biomass allocation and plant functional trait. United States. Ecological Indicators. 102. 302-308. doi.org/10.1016/j.ecolind.2019.02.047.