Revista Mexicana Ciencias Agrícolas volume 11 number 5 June 30 - August 13, 2020
DOI: https://doi.org/10.29312/remexca.v11i5.2293
Article
Biomass and grain yield in triticale varieties in the Mexicali valley
José Luis Velasco López1
Roberto Soto Ortiz1§
Carlos Enrique Ail Catzim1
Onécimo Grimaldo Juárez1
Silvia Mónica Avilés Marín1
Alejandro Javier Lozano del Río2
1Institute of Agricultural Sciences-Autonomous University of Baja California. Highway Delta s/n, Ejido Nuevo León, Mexicali, Baja California, Mexico. CP. 21705. (ljose1924@gmail.com; carlos.ail@uabc.edu.mx; onecimo.grimaldo@uabc.edu.mx; monica-aviles@uabc.edu.mx). 2Department of Plant Breeding-Autonomous Agrarian University Antonio Narro. Saltillo, Coahuila, Mexico. CP. 1923. (ajavierlozanodelrio@gmail.com).
§Corresponding author: roberto-soto@uabc.edu.mx.
Abstract
The Mexicali valley is an important region in the production of meat and milk of bovine origin with acceptance in other countries, mainly the United States of America, Japan and Korea. For this reason, quality forage is required to feed cattle such as triticale, used in various areas of Mexico; however, in the Mexicali valley, there is no information on agronomic behavior. The objective of this study was to evaluate the dry biomass and grain yield of 10 varieties of triticale in the 2014-2015 and 2015-2016 A-W cycles, in the Mexicali valley. The experimental design was randomized complete blocks with three replications. 10 varieties of triticale of different growth types were evaluated, 4 spring, 2 facultative, 4 winter and oats. In the first evaluation cycle, the highest total biomass production corresponded to the variety AN105 and AN125 with 10.7 and 10.5 t ha-1, in grain yield the varieties AN105, AN38, AN125, AN31B, ABT and Eronga produced from 7.3 to 5.4 t ha-1. For the second cycle, the superior varieties in total biomass were AN31B, ABT, AN38, AN34, AN31P and Eronga with 6 to 4.9 t ha-1 and in grain yield AN38, AN123, Eronga and AN125 from 4.1 to 3.1 t ha-1. In conclusion, the winter varieties AN31B and AN34 showed potential for the production of total biomass, the facultative variety AN38 and the spring varieties AN125 and Eronga, showed superiority in grain yield in the two evaluation cycles.
Keywords: X Triticosecale Wittmack, forage, yield components.
Reception date: March 2020
Acceptance date: June 2020
Introduction
Triticale (X Triticosecale Wittmack) is used as feed for fattening cattle and milk, due to its nutritional content in forage and grain, it is within the standards to be considered of high quality when meeting the parameters in neutral detergent fiber content, acid detergent fiber, net energy of lactation, digestibility of dry matter, taste and crude protein, is a crop with the potential to replace other cereals in livestock feed (Gelelcha et al., 2007; Fras et al., 2016).
In addition to presenting greater tolerance to saline soils, high temperatures and greater competitiveness in unfavorable environments than traditional crops such as wheat, oats, barley and rye grass (Hewstone et al., 1977). The agroclimatic conditions previously mentioned are characteristic of the arid regions of Mexico, where the salinity of the soils associated with high temperatures and low precipitation are the main factors that limit the production of forage and grain where the cultivation of triticale can be an alternative to these regions (Ballesteros et al., 2015).
The triticale crop is classified according to its production pattern and need for vernalization in: 1) spring, fast growing (115 days at physiological maturity) and recommended for a cut; 2) facultative, fast growing (145 days to physiological maturity), semi prostrate, recommended for two cuts; and 3) winter, with prostrate and late growth (165 days at physiological maturity) sufficient to perform three to five cuts (Murillo et al., 2001; Lozano del Río et al., 2009).
Studies by Lozano del Río et al. (2004); Mellado et al. (2005) documented green forage yields in spring, winter and facultative triticales with 50, 52 and 46 t ha-1 respectively, grain yields between 8 and 12.72 t ha-1 were also reported under arid zone conditions. It was also reported that the final grain yield is determined by components such as the number of spikes per square meter, spikes size, number of spikelets per spikes, number of grains per spikes and weight of grains per spikes (Biscoe and Gallagher, 1977).
Which are results of the genetic potential of the variety and the environmental conditions in which it develops (Slafer et al., 2006). The importance of obtaining high forage and grain yields in the Mexicali valley is due to the demand for feeding cattle for meat and milk production, but the climatic conditions of this region are limiting to supply the necessary quantity.
The production potential of dry forage in crops such as barley and oats are 5.68 and 6.13 t ha-1 respectively, and in green forage from crops such as sorghum, oats and corn, they report yields of 44.3, 35.9, 58.6 t ha-1, as at grain yield, wheat, sorghum and corn present productions of 5.9, 4.48 and 8.9 t ha-1 (SIAP, 2016). The objective of the present study was to evaluate the dry biomass and grain yield of 10 varieties of triticale in the Mexicali valley.
Materials and methods
Location
The study was carried out during the autumn-winter 2014-2015 (A-W 2014-2015) and autumn winter 2015-2016 (A-W 2015-2016) cycles, in the experimental field of the Institute of Agricultural Sciences of the Autonomous University of Baja California, in the common Nuevo León, Mexicali, Baja California, Mexico, located between the coordinates 32° 24’ north latitude and 115° 11’ west longitude, with an altitude of 15 m, in a clay-textured soil. The climate of the Mexicali valley is classified as hot, very extreme arid, with an average annual temperature of 22. 9 ºC, a maximum of 48. 5 ºC and a minimum during the winter of -7 ºC and an average annual precipitation of 60 mm (Garcia, 1988).
Genetic material
Ten varieties of triticale were evaluated: four of the spring types (AN123, AN125, AN137, Eronga), two of the facultative type (AN105, AN38) and four of the winter type (AN31B, AN34, AN31P, ABT). These materials were provided by the cereal program of the Autonomous Agrarian University ‘Antonio Narro’ for the autumn winter 2014-2015 cycle. In the autumn winter 2015-2016 cycle, the grain harvested from the previous cycle was used as seed and as a control a commercial variety of intermediate/early forage oats (Bachiníva).
Experimental design and agronomic management
The varieties were distributed in a randomized complete block design with 10 and 11 treatments, with three replications in each, during the 2014-2015 A-W and 2015-2016 A-W cycles, respectively. The experimental plot consisted of 6 rows/plot and a distance between rows of 0.3 m by 5 m long (9 m2), the useful plot was 0.5 m from a central row (0.15 m2).
The sowing of the lots was carried out under the traditional system (in plane), by means of a seeder for fine grains model SB-2008 16D, the rows were marked at a distance of 0.3 m, later they were sown manually, in dry soil. In the first cycle of cultivation the sowing was on January 8, 2015 and in the second cycle on November 30, 2015 at a density of 120 kg ha-1 as recommended by Lozano et al. (2009). The plots were separated from each other by 0.30 m and between 1 m blocks, edges were established with a length and height of 0.8 and 0.5 m respectively.
The fertilization formula used was 120-80-00, half of the nitrogen and the total of phosphorus were applied at the time of sowing and the second half of the nitrogen was applied in the second irrigation. The crop was developed in optimal humidity conditions, irrigation was planted at planting and four for relief, when more than 50% of the plots reached the stages of tillering, boot stage, flowering and filling of grain.
Identifying the stages based on the phenological scale proposed by Zadoks et al. (1974) which are 25, 32, 65 and 75 in both cycles, with a total irrigation sheet of approximately 80 cm. Weed control was performed with manual weeding as required. No control of pests and diseases was carried out during crop development due to low incidence.
Variables evaluated
To estimate dry biomass, destructive sampling was performed when each variety reached the herd stage (43, on the Zadoks scale), considering the difference in days due to their type of growth and once they met the cutting criteria. in winter cereals proposed by Lozano del Río et al. (2009) in both cycles, the plants were cut at ground level in a 0.5 linear meter segment, later in the laboratory the leaves and stems of each sample were separated.
They were dried in an oven at 60 °C for 72 h, their weight in grams per plot was recorded and the obtained value was transformed into tons per hectare. For the estimation of the grain yield and its components, when each variety reached the harvest stage, 2 linear meters of plants were cut at ground level in two central rows of each plot, then the material was threshed with a stationary machine. threshed was cleaned, its weight in kilograms was determined and it was transformed to tons per hectare adjusted to a humidity of 12%.
The yield components were estimated from the random collection of 10 spikes of each plot, from which the following variables were measured: length of spikes (LE) and number of spikelets/spikes (EE). Later, the spikes were threshed individually and the complementary variables were measured; grains/spike (GE) and weight of grains/spike (PGE). To estimate the number of spikes m-2 (EM2), the spikes present in two central rows of 1 linear m in each of the plots were counted when more than 50% of the plants reached the stage of physiological maturity (90, in the Zadoks scale).
Statistical analysis
Analysis of variance, comparison of means (Tukey 0.05) and analysis of orthogonal contrasts between the types of growth of the varieties were performed on all variables and by cycle. In both cycles, Pearson's linear correlation analyzes were performed between grain yield and its components. The analyzes were performed with the statistical package SAS 9.0 (SAS, 2002).
Results and discussion
In the A-W 2014/15 cycle, the varieties developed at average temperatures of 15 to 23 ºC, minimums of 8 to 13 ºC and maximums of 23 to 31 ºC and with 215 hours of cold. In the A-W cycle
2015-2016, the average temperatures were from 11 to 21 ºC, minimum from 3 to 12 ºC and maximum from 20 to 29 ºC and with 789 h accumulated emergency cold at physiological maturity (Table 1).
Table 1. Climatic data in which the varieties were developed in the A-W 2014-2015 and A-W 2015-2016 cycles, common Nuevo León, Mexicali, Baja California.
Cycle | Month | Tmax | Tmin | Tmed | HF | ETF |
2014-2015 | January | 23.4 | 8.08 | 15.25 | 97 | Emergency-tillering principle |
February | 27.4 | 9.42 | 17.9 | 164 | Tillering-beginning of stem formation | |
March | 29.4 | 11.74 | 20.5 | 200 | Stem formation-boot stage | |
April | 30.4 | 11.61 | 21.4 | 208 | Boot stage-spike | |
May | 31.7 | 13.74 | 23 | 215 | Grain filling-physiological maturity | |
2015-2016 | December | 20.3 | 3.2 | 11.3 | 367 | Emergency-tillering principle |
January | 20.8 | 5.2 | 12.5 | 633 | Tillering-beginning of stem formation | |
February | 26.5 | 8.2 | 17.1 | 740 | Stem formation-boot stage | |
March | 27.9 | 9.4 | 18.9 | 780 | Spike-Grain filling | |
April | 29.8 | 12.1 | 21.4 | 789 | Physiological maturity |
Tmax= maximum temperature; Tmin= minimum temperature; HF= accumulated cold hours; ETF= average phenological stage of the varieties.
Dry biomass of leaves
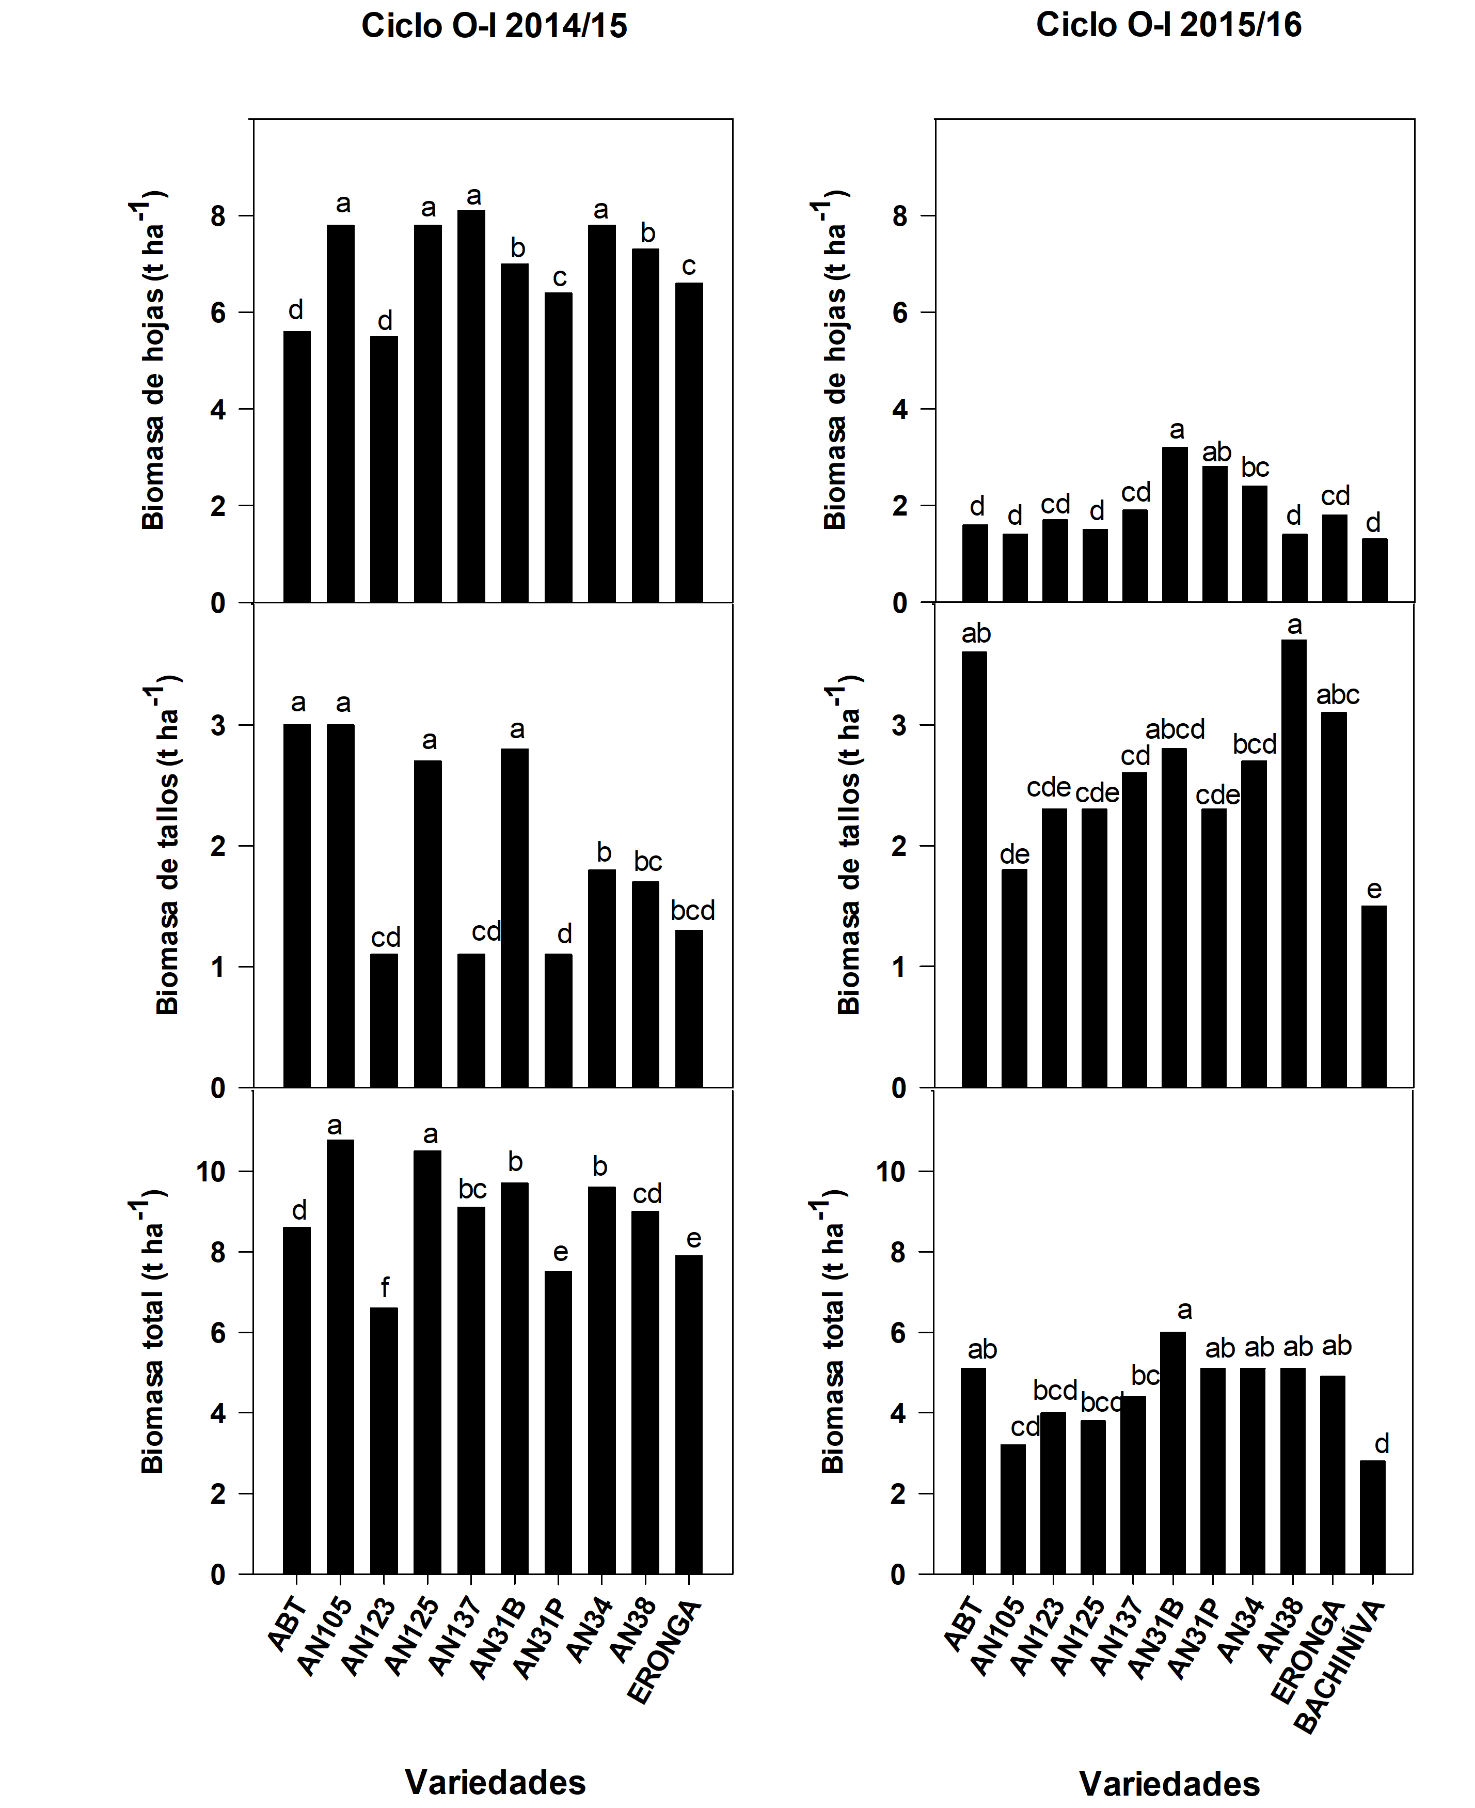
In the A-W 2014-2015 cycle, the results of the analysis of variance showed differences (p≤ 0.01) between the varieties, the means tests showed the varieties AN137 with 8.1 t ha-1 and AN125, AN34, AN105 with 7.8 t ha-1 statistically outstanding with respect to the rest of the varieties. In the second cycle, differences (p≤ 0.01) were observed between the varieties, the means tests showed the AN31B and AN31P varieties with 3.2 and 2.8 t ha-1, respectively, that were superior to the rest of the triticales and oats varieties with 1.3 t ha-1 (Figure 1).
Figure 1. Averages of leaf biomass (BHOJ), stem biomass (BTALL) and total biomass (BTOT) for 10 varieties of triticale cut in the boot stage, evaluated in two cycles, A-W 214-2015 and A-W 2015-2016 in the Mexicali valley, Baja California. Bars with equal letters within each graph do not differ statistically (tukey≤ 0.05).
The analyzes of orthogonal contrasts in the first cycle did not find differences between the different types of growth, unlike in the second cycle differences were observed between the types of triticales, where the winter type was higher in (1.1 t ha-1) than the facultative (0.8 t ha-1), spring and (1.3 t ha-1) and the variety of oats.
Stem dry biomass
In the first cycle, the results of the analysis of variance showed differences (p≤ 0.01) between the varieties, in the means tests it was observed that four varieties of triticale ABT and AN105 with 3 t ha-1, AN31B with 2.8 t ha-1 and AN125 with 2.7 t ha-1 were statistically superior. In the second cycle, differences (p≤ 0.01) were observed between the varieties, the means tests showed triticales AN38, ABT, Eronga and AN31B with yields of 3.7, 3.6, 3 and 2.8 t ha-1, respectively, higher oatmeal (1.5 t ha-1).
The orthogonal contrasts in the first cycle showed statistical differences between winter and spring triticales (p≤ 0.05), the winter ones being higher in (0.6 t ha-1), this is attributed to the fact that winters have greater potential to produce offspring than spring as reported by Lozano et al. (2009). In the second cycle, differences were observed between winter and spring, with winter rates higher (0.1 t ha-1).
Total dry biomass
In the first cycle, the results of the analysis of variance showed differences (p≤ 0.01) between the evaluated varieties, the means tests showed that AN105 and AN125 were superior than the other varieties with productions of 10.7 and 10.5 t ha-1, respectively, in a study by Colin et al. (2009) reported a yield of 7 t ha-1 in triticale under irrigation conditions in the state of Coahuila. In the second cycle, differences were observed (p≤ 0.01)
Among the varieties evaluated, the means tests showed the triticales AN31B (6.0), ABT (5.1), AN38 (5.1), AN34 (5.1), AN31P (5.1) and Eronga (4.9) with the highest yields and superior to the oats (2.8 t ha-1), similar to that reported by Lozano del Río et al. (2009) with yields of 4.1 and maximums of 5.8 t ha-1 in a triticale study carried out in the states of Coahuila, Nuevo León and Chihuahua. Based on the results in this study, triticale may be an option for the conditions of the Mexicali valley.
In the orthogonal contrast analyzes (Table 2), in the first cycle the facultative triticales were superior to the winter and spring triticales in 1.1 and 1.4 t ha-1, respectively. These results are similar to those documented by Lozano et al. (2009) indicating that physicians have the potential to produce sprouts and leaves in semi-arid environments.
Table 2. Comparison of means for dry biomass, by orthogonal contrasts by triticales growth types.
Cycle | Group | BHOJ (t ha-1) | BTALL (t ha-1) | BTOT (t ha-1) | |||
A-W 2014-2015 | PV vs FC | 7 | 7.5 ns | 1.5 | 2.3 ns | 8.5 | 9.9** |
FC vs INV | 7.5 | 6.7 ns | 2.3 | 2.1 ns | 9.9 | 8.8** | |
INV vs PV | 6.7 | 7 ns | 2.1 | 1.5* | 8.8 | 8.5** | |
A-W 2015-2016 | PV vs FC | 1.7 | 1.4 ns | 2.5 | 2.7** | 4.3 | 4.2** |
FC vs INV | 1.4 | 2.5** | 2.7 | 2.8 ns | 4.2 | 5.3** | |
INV vs PV | 2.5 | 1.7** | 2.8 | 2.5** | 5.3 | 4.3** | |
PV vs BC | 1.7 | 1.2 ns | 2.5 | 1.5** | 4.3 | 2.7** | |
FC vs BC | 1.4 | 1.2 ns | 2.7 | 1.5 ns | 4.2 | 2.7 ns | |
INV vs BC | 2.5 | 1.2** | 2.8 | 1.5 ns | 5.3 | 2.7** | |
TCL vs BC | 2 | 1.2 ns | 2.7 | 1.5 ns | 4.7 | 2.7 ns | |
Groups= triticales growth types; PV= spring; FC= facultative; INV= winter; TCL= triticales; BC= oats variety Bachiníva; A-W 2014-2015= Autumn Winter 2014-2015 cycle; A-W 2014-2015= Autumn Winter 2015-2016 cycle; BHOJ= leaf biomass; BTALL= biomass of stems; BTOT= total biomass; NSF= level of significance; ns= not significant; *= significant at 0.05; **= significant at 0.01.
Therefore, facultative triticales may be potential for the production of cut dry forage in the boot stage. In the second cycle the winters were higher than the facultative ones and the spring ones in (1.1 t ha-1), finally the spring and winter ones were superior to the oats in (1.5 and 2.6 t ha-1).
Spike length
In both cycles, the analysis of variance did not show differences between varieties, in the first cycle the values were from 10.4 to 12.9 cm and in the second from 9.5 to 11.5 cm. Mendoza et al. (2014) report values between 16.6 and 17.2 cm in triticale varieties evaluated for seed production with 50% chemical fertilization and 50% biofertilizer. The orthogonal contrasts in the first cycle did not find differences between the growth types of triticales, in the second cycle the spring ones were higher than the facultative ones with 1.1 cm and the winter ones were higher than the spring ones with 0.1 cm.
Spikelets per spike
The analysis of variance showed differences (p≤ 0.01) between the varieties, the means tests (Tables 3 and 4) showed the varieties AN105, AN31B, AN34, AN31P, AN38 and Eronga, superior with values between 29.6 and 32. In statistical differences were observed in the second cycle (p≤ 0.01), varieties ABT, AN31P, AN31B, AN34 and AN38 were the ones with the highest values ranging from 24.8 to 28.8 spikelets per spikes.
Table 3. Average grain yield and its components for 10 varieties of triticale, evaluated in the Mexicali valley, Baja California (A-W 2014-2015).
Varieties | RG (t ha-1) | EM2 | LE (cm) | EE | GPE | PGE (g) |
AN123 | 4.3 bcd | 335 a | 10.4 a | 25.6 b | 62.3 a | 2.5 ab |
AN125 | 6.1 ab | 450 a | 10.5 a | 26.3 b | 59 a | 2.3 b |
AN137 | 4.5 bcd | 285 b | 12 a | 28 b | 67.6 a | 3 ab |
Eronga | 5.4 abcd | 444 a | 11.8 a | 29.6 ab | 63 a | 2.5 ab |
AN105 | 7.3 a | 390 a | 11.8 a | 32 ab | 62 a | 2.4 b |
AN38 | 6.9 a | 425 a | 10.8 a | 29.6 ab | 73.3 a | 2.6 ab |
AN31B | 5.7 abc | 381 a | 11.3 a | 31 ab | 59.6 a | 2.2 b |
AN34 | 4 cd | 318.3 a | 12 a | 31 ab | 60.3 a | 2.4 b |
AN31P | 3.6 d | 284.3 a | 11.6 a | 31 ab | 56.3 a | 2 b |
ABT | 5.7 abc | 286 a | 12.9 a | 36.0a | 73.3 a | 3.5 a |
CV% | 12.1 | 24.4 | 9.1 | 7.9 | 11.1 | 14 |
DMS | 1.9 | 257.8 | 3.1 | 6.9 | 20.8 | 1 |
Spring | 5.1 | 378.8 | 11.2 | 27.4 | 63 | 2.6 |
Facultative | 7.1 | 407.7 | 11.3 | 31 | 67.7 | 2.5 |
Winter | 4.8 | 317.5 | 12 | 32.2 | 62.4 | 2.6 |
Within each column, means with equal literals are not statistically different (Tukey α= 0.05); CV= coefficient of variation in %; DMS= Minimal significant difference; A-W 2014-2015= Autumn Winter 2014-2015 cycle; A-W 2015-2016= Autumn Winter 2015-2016 cycle; LE= spike length; EE= spikelets per spike; GPE= grains per spike; PGE= weight of grains per spike; EM2= spikes per square meter; RG= grain yield.
Table 4. Average grain yield and its components for 10 varieties of triticale, evaluated in the Mexicali valley, Baja California (A-W 2015-2016).
Varieties | RG (t ha-1) | EM2 | LE (cm) | EE | GPE | PGE (g) |
AN123 | 3.5 ab | 238.6 b | 11.3 a | 24.7 bc | 66.6 a | 2.3 a |
AN125 | 3.1 abc | 326 ab | 10.3 a | 24.6 bc | 54.6 abc | 1.9 a |
AN137 | 2.8 bcd | 284.6 ab | 10.7 a | 22.8 c | 62.2 ab | 1.9 a |
Eronga | 3.3 abc | 271.3 ab | 10.4 a | 23 c | 51.4 bc | 2.3 a |
AN105 | 2.5 bcde | 274 ab | 9.5 a | 22 c | 48.1 c | 1.6 a |
AN38 | 4.1 a | 376 a | 9.8 a | 24.8 abc | 56.1 abc | 1.8 a |
AN31B | 1.4 ef | 315.6 ab | 10.9 a | 27.3 ab | 50.5 bc | 1.6ª |
AN34 | 1.5 def | 248 b | 10.1 a | 25.7 abc | 50.8 bc | 1.4 a |
AN31P | 1.2 f | 274.3 ab | 10.8 a | 28 ab | 53.5 abc | 1.4 a |
ABT | 2.2 cdef | 268.6 ab | 11.5 a | 28.8 a | 65.1 a | 2.4 a |
CV% | 17.1 | 13.9 | 6.7 | 5.4 | 8 | 22 |
DMS | 1.2 | 117.8 | 2.1 | 4.0 | 13.1 | 1.2 |
Spring | 3.2 | 280.2 | 10.7 | 23.8 | 58.7 | 2.1 |
Facultative | 3.3 | 325.2 | 9.6 | 23.4 | 52.1 | 1.7 |
Winter | 1.6 | 276.7 | 10.8 | 27.5 | 55 | 1.8 |
Within each column, means with equal literals are not statistically different (Tukey α= 0.05); CV= Coefficient of variation in (%); DMS= minimum significant difference; A-W 2014-2015= Autumn Winter 2014-2015 cycle; A-W 2015-2016= Autumn Winter 2015-2016 cycle; LE= spike length; EE= spikelets per spike; GPE= grains per spike; PGE= weight of grains per spike; EM2= spikes per square meter; RG= grain yield.
The number of spikelets per spike found in both cycles are similar to those documented by Mohammed et al. (2011) who recorded 25 to 30 spikelets per spike, this author notes that the number of spikelets per spike is determined by genetic heritability rather than by climatic conditions.
The orthogonal contrasts in the first cycle showed that the winter ones are superior to the facultative ones and the spring ones in 1.2 and 4.8. In the second cycle the springs were higher than the facultative ones in 0.4 and the upper winters of the facultative ones in 4.1 spikelets per spike.
Grains per spike
In the first cycle, no differences were found between the varieties with values between 56 and 73. In contrast, in the second cycle, statistical differences (p≤ 0.01) were observed between the varieties, the means tests (Tables 3 and 4) showed varieties AN123, ABT, AN137, AN38 and AN31B, with the highest values between 53 and 66 grains per spikes. This behavior could be due to the fact that during the development of the grain the environmental conditions allowed a good pollination and grain formation for all the varieties.
Grain weight per spike
The analysis of variance showed differences (p≤ 0.01) between the varieties, the means tests (Tables 3 and 4) showed the varieties ABT, AN137, AN38, AN123 and Eronga, with the highest grain weights per spike ranging from 2.5 to 3.5 g. In the second cycle, no differences were observed between the varieties with values from 2 to 3.5. These results are similar to what Ballesteros et al. (2015) with values of 2.24 to 3.6 g per spikes, which is determined by the amount of nitrogen applied and the climatic conditions of the crop cycle.
Spikes per square meter
In the analysis of variance no differences were observed between the varieties, the observed values were from 284 to 450. Unlike the second cycle, where statistical differences (p≤ 0.01) were observed between varieties, AN38, AN125, AN31B, AN137, AN31P, AN105, Eronga, and ABT presented the highest values between 268 to 376 spikes per m2 (Tables 3 and 4).
The orthogonal contrasts in the first cycle did not show differences between types of triticales, in the second cycle the facultative triticales were differentiated from the spring triticales with 45 more spikes per m2. These values are higher than that reported by Paccapelo et al. (2017) from 235 to 314 spikes per m2.
Grain yield
In the first cycle, the analysis of variance showed differences (p≤ 0.01) between the varieties, the means tests (Tables 3 and 4) showed the varieties AN105, AN38, AN125, AN31B, ABT and Eronga, with higher yields of 7.3, 6.9, 6.1, 5.7, 5.7 and 5.4 t ha-1, respectively. These values are similar to those reported by Mendoza et al. (2011) with 6.61 t ha-1, Castro et al. (2011) 5.5 t ha-1 and Goyal et al. (2011) 5.6 t ha-1, who document that the fertilization, date and planting density of the triticale crop influence the final grain yield.
In the second cycle, statistical differences (p≤ 0.01) were observed between varieties, presenting AN38, AN123, Eronga and AN125 the highest yields with values of 4.1, 3.5, 3.3 and 3.1 t ha-1, respectively (Tables 3 and 4). The higher grain yield of the varieties observed in the A-W 2014-2015 cycle, was possibly due to the presence of cool days (average daily temperatures, 18 to 22 °C) during the spike and anthesis stages, which favored the good development of the spikes and filled with grain.
Unlike the A-W 2015-2016 cycle, the wide variation in daily temperatures during the stages of enchanting (8 to 19 ºC) and spike (12 to 21 ºC), possibly affected the grain yield. In the orthogonal contrast analyzes (Table 5), in the first cycle the facultative triticales were differentiated from the spring grain yield exceeding them by 2 t ha-1 and the spring from the winter with a superiority of 0.3 t ha-1, in the second cycle, the physicians differed from the spring and winter with 0.1 and 1.7 t ha-1.
Table 5. Comparison of means for grain yield and its components, by orthogonal contrasts by triticales growth types.
Group | RG (t ha-1) | EM2 | LE (cm) | EE | GE | PGE (g) | ||||||
A-W 2014-2015 | ||||||||||||
Pv vs Fc | 5.1 | 7.1** | 378.8 | 407.7 ns | 11.2 | 11.3 ns | 27.4 | 31 ns | 63 | 67.7 ns | 2.6 | 2.5 ns |
Fc vs Inv | 7.1 | 4.8 ns | 407.7 | 317.5 ns | 11.3 | 12 ns | 31 | 32.2** | 67.7 | 62.4 ns | 2.5 | 2.6 ns |
Inv vs Pv | 4.8 | 5.1** | 317.5 | 378.8 ns | 12 | 11.2 ns | 32.2 | 27.4** | 62.4 | 63 ns | 2.6 | 2.6 ns |
A-W 2015-2016 | ||||||||||||
Pv vs Fc | 3.2 | 3.3** | 280.2 | 325.2* | 10.7 | 9.6** | 23.8 | 23.4** | 58.7 | 52.1 ns | 2.1 | 1.7 ns |
Fc vs Inv | 3.3 | 1.6** | 325.2 | 276.7 ns | 9.6 | 10.8 ns | 23.4 | 27.5** | 52.1 | 55 ns | 1.7 | 1.8 ns |
Inv vs Pv | 1.6 | 3.2 ns | 276.7 | 280.2 ns | 10.8 | 10.7** | 27.5 | 23.8 ns | 55 | 58.7 ns | 1.8 | 2.1 ns |
Groups= triticales growth types; Pv= spring; Fc= facultative; Inv= winter; A-W 2014-2015= Autumn Winter 2014-2015 cycle; A-W 2014-2015= Autumn Winter 2015-2016 cycle; RG= grain yield; EM2= spikes per square meter; LE= spike length; EE= spikelets per spike; GPE= grains per spike; PGE= weight of grains per spike; ns= not significant; *= significant at 0.05; **= significant at 0.01.
The superiority of the facultatives may be due to the temperatures in the flowering and grain filling period, which possibly ensured optimal pollination with minimum, maximum and average temperatures of 11, 30 and 21 ºC and adequate grain filling with temperatures minimum, maximum and average of 13, 31 and 23 ºC, these values are within the range reported by Felix et al. (2009) with optimal temperatures in flowering of 10 to 24 ºC and from 12 to 26 ºC in grain filling.
So the variations in temperatures between highs and lows during the day influenced grain yield in the varieties, which accumulated cold hours from planting to harvest, since in the 2014-2015 cycle the accumulated cold hours were 215 and in the 2015-2016 cycle there were 789.
Grain yield correlation and its components
Correlation analyzes for both cycles (Table 6), showed that spikes per m2 and grain weights per spikes are more correlated with grain yield (r= 0.57), than the rest of the components. Grains per spike, spikelets per spike and spike length had a lower correlation of r= 0.49, r= 0.46 and r= 0.32, respectively, which is in agreement with that reported by Paccapelo et al. (2004); Abeledo et al. (2003); Castro et al. (2011).
Table 6. Correlation coefficients of grain yield and its components, for 10 varieties of triticale evaluated in the Mexicali valley, Baja California. (A-W 2014-2015 and A-W 2015-2016).
EM2 | EE | GE | LE | PGE | |
EE | 0.08 | ||||
GPE | 0.05 | 0.57*** | |||
LE | -0.04 | 0.76*** | 0.66*** | ||
PGE | 0.08 | 0.49*** | 0.72*** | 0.56*** | |
RG | 0.57*** | 0.46*** | 0.49*** | 0.32** | 0.57*** |
LE= spike length; EE= spikelets per spike; GPE= grains per spike; PGE= weight of grains per spike; EM2= spikes per square meter; RG= grain yield; *= significant at 0.05; **= significant at 0.01; ***=significant at 0.001.
Therefore, the greatest increases in grain yield in triticale would be possible if the production of spikes per unit area, weight of grains per spike, grains per spike and spikelets per spike is increased as reported by Solis et al. (2004).
Conclusions
For the agroecological conditions prevailing in the present study, the winter varieties AN31B and AN34 showed potential for the production of total biomass, the facultative variety AN38 and the spring varieties AN125 and Eronga, showed superiority in grain yield in the two evaluation cycles. The grain yield of the triticales evaluated was explained by the components spikes per square meter, weight of grains per spikes, grains per spikes and spikelets per spikes were also affected by the variation in maximum and minimum temperatures during the development of the crop.
The oat variety (Bachiníva) had a lower yield of total biomass, leaf biomass and stem biomass than the triticale varieties. The triticales of winter types presented the highest productive potential in total dry biomass, those of the facultative and spring type in grain yield. For the dual-purpose production of forage and grain, the facultative type AN38 variety of triticale can be an option for the Mexicali valley, being competitive in forage with respect to oats and grain with respect to wheat.
Cited literature
Abeledo, L. G.; Calderini, D. F. and Slafer, G. A. 2003. Genetic improvement of yield responsiveness to nitrogen fertilization and its physiological determinants in barley. Euphytica. 133(3):291-298.
Ballesteros, R. E.; Morales, R. E. J.; Franco, M. O.; Santoyo, C. E.; Estrada, C. G. y Gutiérrez, R. F. 2015. Manejo de fertilización nitrogenada sobre los componentes del rendimiento de triticale. Rev. Mex. Cienc. Agríc. 6(4):721-733.
Biscoe, P. V. and Gallagher, J. N. 1977. Weather, dry matter production and yield. In: Landsberg, J. J. and Cutting, C. V. (Ed.). Environmental effects on crop physiology. Academic Press, London. 75-100 pp.
Castro, N.; Rufach, H.; Capellino, F.; Domínguez, R. y Paccapelo, H. 2011. Evaluación del rendimiento de forraje y grano de triticales y tricepiros. Rev. Investig. Agrop. 37(3):281-289.
Colín, R. M.; Zamora, V. V. M.; Torres, T. M. A. y Jaramillo, S. M. A. 2009. Producción y valor nutritivo de genotipos imberbes de cebada forrajera en la región lagunera de México. Téc. Pec. Méx. 47(1):27-40.
Félix, V. P.; Ortiz, E. J.; Fuentes, D. G.; Quintana, Q. J. y Grajeda, G. J. 2009. Horas frío con relación al rendimiento de trigo. Áreas de producción del estado de Sonora. Instituto Nacional de Investigaciones Forestales Agrícolas y Pecuarias (INIFAP)-Centro de Investigación Regional del Noroeste (CIRNO)-Campo Experimental Valle del Yaqui, Ciudad Obregón, Sonora, México. Folleto técnico núm. 63. 44 p.
Fras, A.; Gołebiewska, K.; Gołebiewski, D.; Mankowski, D. R.; Boros, D. and Szecówka, P. 2016. Variability in the chemical composition of triticale grain, flour and bread. J. Cereal Sci. 71:66-72.
García, E. 1988. Modificaciones al sistema de clasificación climática de Köppen. Instituto de Geografía. Universidad Nacional Autónoma de México (UNAM). México, DF. 217 p.
Gelelcha, S.; Fantahun, B.; Yaie, B. and Girma, B. 2007. Triticale (X Triticosecale Wittmack) a new addition to the Ethiopian cereals. Afr. Crop Sci. Conf. Proceed. 8(1):1991-1995.
Goyal, A.; Beres, B. L.; Randhawa, H. S.; Navabi, A.; Salmon, D. F. and Eudes, F. 2011. Yield stability analysis of broadly adaptative triticale germplasm in southern and central Alberta Canada, for industrial end-use suitability. Canad. J. Plant Sci. 91(1):125-135.
Hewstone, C.; Acevedo, J. and Clarke. M. 1977. Comportamiento de triticales bajo condiciones extremas de humedad en la zona sur. In: Hewstone, C. (Ed.). Estudios preliminares de triticales en la zona sur de Chile. INIA Publ. Misc. 5. Instituto de Investigaciones Agropecuarias-Estación Experimental Carillanca. Temuco, Chile. 26-29 pp.
Lozano del Río, A. J.; Zamora, V. V. M.; Ibarra, J. L.; Rodríguez, H. S. A.; De la cruz, L. E. y De la rosa, I. M. 2009. Análisis de la interacción genotipo-ambiente mediante el modelo AMMI y potencial de producción de triticales forrajeros (X Triticosecale Wittmack). Universidad y Ciencia. 25(31):81-92.
Lozano del Río, A. J.; Hernández, A.; González, R. and Béjar, M. 2004. Triticale in México. In: Mergoum, M. and Gómez-Macpherson, H. (Ed.). Triticale improvement and production. Food and Agriculture. Organization of the United Nations. Rome. 123-130 pp.
Mellado, Z. M.; Madariaga, B. R. and Matus, T. E. I. 2005. Aguacero-INIA, nuevo cultivar de triticale de primavera para Chile. Agric. Téc. 65(1):90-95.
Mendoza, E. M.; Cortez, B. E.; Rivera, R. J. G.; Rangel, L. J. A.; Andrio, E. E. and Cervantes, O. F. 2011. Época y densidad de siembra en la producción y calidad de semilla de triticale (X Triticosecale Wittmack). Agron. Mesoam. 22(2):309-316.
Mendoza, E. M.; Sámano, R. S.; Cervantes, O. F.; Andrio, E. E.; Rangel, L. J. A. y Rivera, R. J. G. 2014. Evaluación de la fertilización integral en la producción de semilla de triticale (X Triticum secale Wittmack). Phyton. 83(1):93-100.
Mohammad, F.; Ahmad, I.; Khan, N. U.; Maqbool, K.; Naz, A. and Shaheen, S. 2011. Comparative study of morphological traits in wheat and triticale. Pakistan J. Bot. 43(1):165-170.
Murillo, A. B.; Escobar, H. V.; Fraga, M. H. and Pargas, L. R. 2001. Rendimiento de grano y forraje de líneas de triticale y centeno en Baja California Sur, México. Rev. Fitotec. Mex. 24(2):145-153.
Paccapelo, H. A.; Funaro, D. O.; Mac, C. T. B. and Melis, O. A. 2004. Rendimiento de grano y sus componentes en cereales sintéticos (tricepiros y triticales). Rev. Fac. Agron. Universidad Nacional de la Pampa. 15(1-2):3-8.
SAS, Institute, Inc. 2002. Version 9.0 of system SAS for Windows, copyright. SAS Institute Inc. Cary, NC. USA.
SIAP. 2016. Servicio de Información Agroalimentaria y Pesquera. http://www.gob.mx/siap/.
Slafer, G. A. and Savin, R. 2006. Physiology of crop yield. In: encyclopedia of plant and crop science. (Ed. Goodman, R.). Taylor and Francis, New York. 1360 p.
Solís, M. E.; Hernández, M. M.; Borodanenko, A.; Aguilar, A. J. L. and Grajeda, C. O. A. 2004. Duración de la etapa reproductiva y el rendimiento de trigo. Rev. Fitotec. Mex. 27(4):323-332.
Zadoks, J. C.; Chang, T. T. and Konzak, C. F. 1974. A decimal code for the growth stages of cereals. Weed Res. 14(6):415-421.