Revista Mexicana Ciencias Agrícolas volume 11 number 4 May 16 - June 29, 2020
DOI: https://doi.org/10.29312/remexca.v11i4.2049
Article
Analysis of the competitiveness indicators of strawberry exports Mexican
Laura Cecilia Ramírez Padrón1
Ignacio Caamal Cauich1§
Verna Gricel Pat Fernández1
David Martínez Luis2
Alberto Pérez Fernández2
1Chapingo Autonomous University. Mexico-Texcoco Highway km 38.5. Texcoco, State of Mexico. CP. 56230. (laura.ramirez.lr826@gmail.com; gricelpat@hotmail.com). 2Autonomous University of Carmen. Calle 56, No. 4, Esq. Avenida Concordia, Col. Benito Juárez, Carmen City, Campeche, Mexico. CP. 24180. (Luis-david25@hotmail.com; albertopefe@gmail.com).
§Corresponding author: icaamal82@yahoo.com.mx.
Abstract
The main strawberry producing countries are China, the United States of America, Mexico, Turkey and Egypt, which together contribute more than seventy percent of the total volume of strawberry production in the world and, on the other hand, the main exporting countries are Spain, the United States of America, Mexico, the Netherlands and Belgium, highlighting Mexico as the third largest strawberry producer and exporter in the world. The objective of the work is to analyze the competitiveness of the exports of the Mexican strawberry in the world exporting market, with the calculation of the export indexes, relative advantage of exports and revealed comparative advantage, with statistical information of the production variables, export and import, taken from the FAS-USDA and FAOSTAT databases. The export indices obtained, greater than zero, relative advantage of exports, greater than one and revealed comparative advantage, greater than one, reflect that the production of Mexican strawberry has an export specialization and the exports of Mexican strawberry are competitive in the export market. Likewise, the positive calculated indexes for the main exporting countries were higher for Spain, followed by Mexico and finally by the United States of America, reflecting export specialization and competitiveness of differentiated exports.
Keywords: competitiveness, export, import, production.
Reception date: March 2020
Acceptance date: May 2020
Introduction
Strawberry is a highly prized fruit for its pleasant sweet and sour taste, its attractive aroma, its nutritional properties and medicinal qualities. Strawberry contains vitamin C, tannins, flavonoids, anthocyanins, catechins, quercetin and kaempferol, organic acids (citric, malic, oxalic, salicylic and ellagic), minerals (potassium, phosphorus, calcium, sodium and iron), pigments and essential oil, these compounds have a powerful antioxidant power and help to decrease the risk of cardiovascular diseases, improve vascular endothelial function and decrease thrombosis (Özcan, 2007; Pinto et al., 2008; Beattie et al., 2005, cited by Restrepo et al., 2009).
The chemical composition of the strawberry is 89.6% water, it includes carbohydrates, proteins, lipids and fiber; furthermore, strawberry contains 35 calories for every one hundred grams (Chordi, 2013). The world strawberry production in 2016 was 9 059 817 t, with the main producing countries China with 3 779 831 t, United States of America (USA) with 1 431 050 t, Mexico with 468 248 t, Turkey with 415 150 t and Egypt with 378 960 t, which contributed 71.45% of the total strawberry produced in the world (FAOSTAT, 2019).
On the other hand, world strawberry exports in 2016 amounted to 853 213 t, the main exporters being Spain with 314 256 t, the United States of America with 134 406 t, Mexico with 102 631 t, the Netherlands with 48 425 t and Belgium with 40 718 t, exported respectively, which contributed 75.06% of world strawberry exports. Mexico was the third largest producer and exporter of strawberry in the world market (FAOSTAT, 2019).
The world export coefficient for strawberries is 9.4%, indicating that it is a product of greater domestic consumption. World strawberry production was 3 392 922 t in 1994 and 9 059 817 t in 2016, with a growth rate of 167.02%. Strawberry production in China was 750 000 tons in 1994 and 3 779 831 tons in 2016, with a growth rate of 403.98%, in USA was 748 330 t in 1994 and 1 431 050 t in 2016, with a growth rate of 91.23%, in Mexico it was 95 006 t in 1994 and 468 248 t in 2016, with a growth rate of 392.86%, in Turkey it was 65 000 tons in 1994 and 415 150 tons in 2016, with a growth rate of 538.69% and in Egypt production was 27 000 tons in 1994 and 378 960 t in 2016, with a growth rate of 1 303.56% (FAOSTAT, 2019).
Exports in the world of strawberry were 392 660 t in 1994 and 862 830 t in 2016, with a growth rate of 119.74%. Exports in Spain were 159 508 t in 1994 and 314 256 t in 2016, with a growth rate of 97.02%, in USA, they were 57 450 t in 1994 and 134 406 t in 2016, with a growth rate of 133.95%, in Mexico they were 19 471 t in 1994 and 102 631 t in 2016, with a growth rate of 427.10%, in the Netherlands they were 15 785 t in 1994 and 48 425 t in 2016, with a growth rate of 206.78% and in Belgium, exports from 2000 were 39 553 t and 40 718 t in 2016, with a 2.95% growth rate. The main destination of Mexico’s strawberry exports is the United States of America, which receives 99.8% of Mexico’s total exports (FAOSTAT, 2019).
The positive and high growth rates of world production and exports and in the main producing and exporting countries reflects that strawberry cultivation is expanding and competitive.
The objective of the work is to analyze the competitiveness of strawberry exports from Mexico, based on export rates, relative advantage of exports and revealed comparative advantage and also, compare the competitiveness of Mexican strawberry exports with the competitiveness of exports of the other main strawberry exporting countries in the world, Spain and the United States of America. The working hypothesis states that Mexican strawberry exports are competitive in the export market and the indicators of competitiveness and revealed comparative advantage are positive and increasing.
Theoretical framework
The total market share of a country in a given sector of international commercial activity is known as global competitiveness, involving the growth of all aggregate sectors and the penetration of countries in international markets (Mortimore et al., 1997). The competitiveness of a country occurs when said country, under free and fair market conditions, produces goods and services that exceed the average produced in international markets (OCDE, 1992).
Competitiveness from its origins has been linked to international trade, understood as the ability of a given nation to successfully insert itself in the international market (Daza, 2014), so the measurement of competitive advantages through the analysis of trade flows, imports and exports of a country in the international market, is relevant. The measurement of a country's participation in the markets can be done through indirect indicators such as the revealed comparative advantage index.
Which follows from the comparative advantage, which is a natural advantage, and occurs when it is produced better and with lower relative cost compared to another country, where countries tend to specialize in the production and export of those products with lower relative cost (Vargas, 2014). The theory of comparative advantage refers to the greater efficiency in the production of some national goods, with a lower comparative cost of production, leading to a more advantageous exchange, being the base of the export of the countries that participate in international trade (Salazar, 2015).
The comparative advantage between countries is related to production efficiency and the country with the lowest opportunity cost will be the one that is more efficient and thus has a comparative advantage over the others (Arias and Segura, 2004). The comparative advantage is used to study the terms of trade between two or more countries and between a given country and the rest of the world (Ayvar et al., 2018), the country in which the added value is greater than the value of the domestic resources will present comparative advantages (Contreras, 1999).
Comparative advantage can be assessed with the indicators of revealed comparative advantage. Balassa (1965), was the first to coin the term of revealed comparative advantage to indicate that comparative advantages can be revealed by merchandise trade flows, exchange reflects relative costs and other factors that affect commercial transactions (Heredia and Huarachi, 2009) and also measures the degree of importance of a product.
Within exports from one market to another market, versus the importance of exports of the same product in exports of the same product to the world (De Pablo and Giacinti, 2011). Likewise, to measure the competitiveness of exports in the international market, the revealed comparative advantage indicator (IVCR) established by Vollrath can be used, where international competitiveness is examined through measurements, they use trade data such as exports and imports and, in this way, incorporate the effects of relative supply and demand for goods (González, 2017), using the relative export advantage index (IVRE) and the revealed comparative advantage index (IVCR). The relative export advantage (VRE) indicates the advantages of a country in reference to its total exports, as well as its participation to the rest of the world and is measured through the revealed comparative advantage index.
The value of the IVRE will suggest the existence of comparative advantage or specialization in the exports of a certain product (Ávila and González, 2012), a positive value, greater than zero, indicates the existence of a revealed comparative advantage and the higher the value of the higher the degree of specialization will be and it will reveal greater competitiveness, the increasing trend over the years will indicate greater competitiveness in the market (Avendaño, 2008).
The competitiveness and comparative advantage indexes of exports (export coefficient or index, relative advantage index of exports and revealed comparative advantage index) are useful to carry out analyzes at the level of economic aggregates, and allow identifying the existence of comparative advantage, based on internal resources (natural, labor and capital), export specialization and competitiveness in the export market (Vargas, 2014; González, 2017).
The revealed comparative advantage index (IVCR) is useful for evaluating the specialization in the export of a product, in this case strawberry, in relation to the totality of products exported by a country compared to the world (De Pablo and Giacinti, 2011), the IVCR can adopt positive or negative values, reflecting the competitive position of a country in the international market with the product in trade.
Research carried out by Arias and Segura (2004) refer that when the IVCR takes values greater than zero, the product in trade has a revealed comparative advantage because the country’s exports exceed imports, and the higher the value of the IVCR of good, will have greater competitiveness in the international market.
Materials and methods
The calculated revealed comparative advantage and competitiveness indices are the export coefficient, the relative comparative export advantage and the revealed comparative advantage for Spain, the United States of America and Mexico since they are the main strawberry exporting countries.
Calculation procedures
The export coefficient (CE) indicates the proportion of national production that is exported and the higher the value of the coefficient, the greater the competitiveness of the product in trade and is calculated with the following formula:  ; where: CE= export coefficient, XTX= total exports of product x, QTX= total production of product x.
The relative export advantage index (IVRE) reflects the advantages or disadvantages of a country’s exports in the world (Avila and Gonzalez, 2012) and It is obtained as follows:  , where:
  = relative advantage index of export of the product a in country i;
  = value of exports of product a in country i;
  = value of total exports less product a in country i;
  = value of exports of product a in the world (minus country i);
  = value of total exports (minus product a) in the world (minus country i).
The revealed comparative advantage index (IVCR) reflects the specialization and competitiveness of the export of a product in relation to the rest of the products with the world (Vollrath, 1991) and is calculated with the following formula:  , where:
  = revealed comparative advantage index of exports, which is obtained as follows:
  , where:
  = revealed comparative advantage index of imports and is calculated using the following equation:
  Where: X and M are exports and imports respectively, i is the country for which the analysis is being carried out, r refers to the rest of the world except the country of analysis (country i), a is the good or merchandise that is being investigating and n involves the trade of all the merchandise except the good in analysis (good a).
Variables
For the calculation of the export coefficient, data on the export and production of strawberry in tons were used, to obtain the Index of relative export advantage and the index of revealed comparative advantage of Vollrath, trade data such as the value of the exports of strawberry in Mexico, value of total exports of agricultural products (minus strawberry) in Mexico, value of strawberry exports in the world (minus Mexico).
Value of total exports of agricultural products (less strawberry) in the world (less Mexico), value of imports of strawberry in Mexico, value of total imports of agricultural products (less strawberry) in Mexico, value of imports of strawberry in the world (less Mexico), value of total imports of agricultural products (less strawberry) in the world (less Mexico). The sources of the statistical data used were the Foreign Agricultural Service’s Global Agricultural Trade System (FAS-USDA) and the Food and Agriculture Organization of the United Nations (FAOSTAT), the period consulted was from 1994 to 2016.
Results and discussion
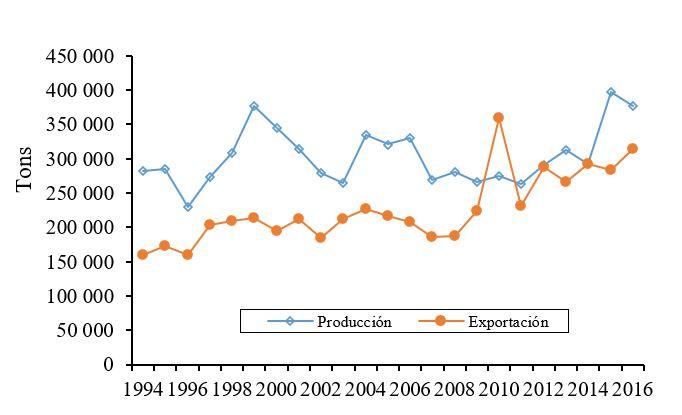
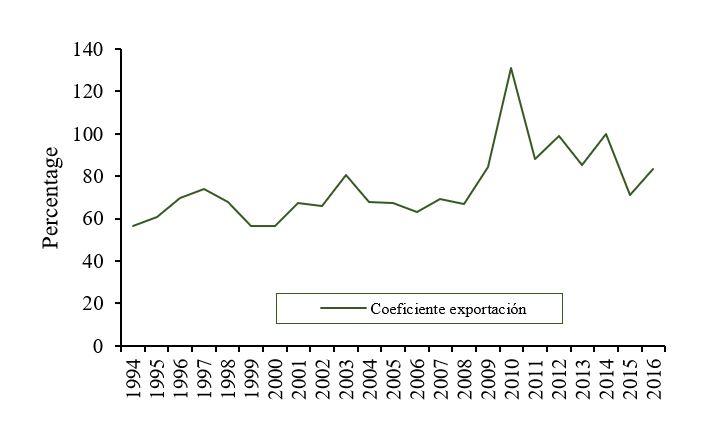
The main strawberry exporters in the world are Spain, the United States of America and Mexico, which have been contributing increasingly the highest volumes of strawberry production and export throughout the period from 1994 to 2016 (FAOSTAT, 2019). In 1994, Spain, with a production of 282 200 tons and an exported volume of 159 508 tons, had an export coefficient of 56.5%, reflecting that more than half of production was destined for export, in 2016.
Strawberry production in Spain was 377 596 t and the export volume of 314 256 t (Figure 1 and 2), with an export coefficient of more than 80%, indicating that Spain is a highly competitive country in production and Strawberry export, since a high proportion of the production is destined for the external market (FAOSTAT, 2019).
Figure 1. Strawberry production and export in Spain, 1994-2016. Prepared with data from FAOSTAT (2019).
Figure 2. Strawberry export coefficient in Spain, 1994-2016. Prepared with data from FAOSTAT (2019).
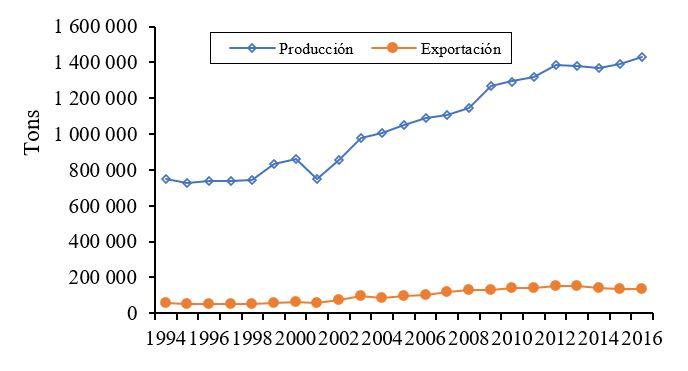
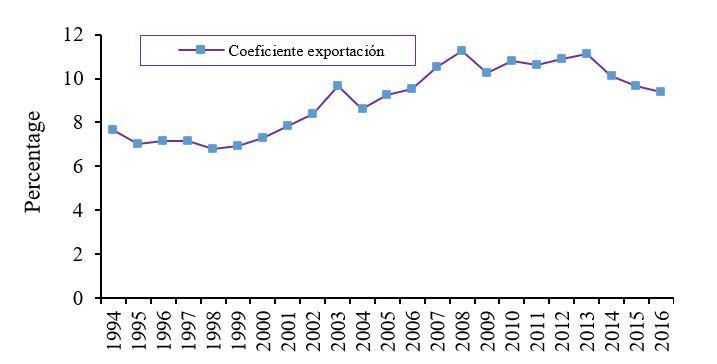
The United States of America in 1994 had a production of 748 330 t and the exported volume was 57 450 t, with an export coefficient of 7.7%, reflecting that a low proportion of production was destined for export; while in 2016 production was 1 431 050 t and exports amounted to 134 406 t, with an export coefficient of 9.3% (Figure 3 and 4), reflecting a low coefficient of export and export volume, which is due to that a large part of the production is destined to satisfy the demand of the domestic market (FAOSTAT, 2019).
Figure 3. Strawberry production and export in the United States of America 1994-2016. Prepared with data from FAOSTAT (2019).
Figure 4. Strawberry export coefficient in the United States of America 1994-2016. Prepared with data from FAOSTAT (2019).
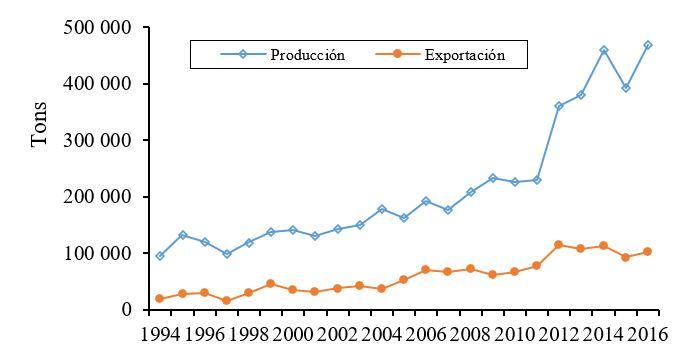
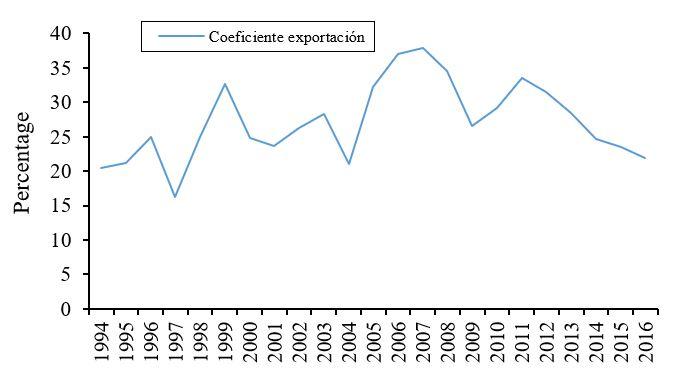
Mexico, which is another of the main strawberry producers and exporters worldwide, in 1994 produced 95 006 t and exported 19 471 t and the export coefficient was 20.49%, in 2016 strawberry production in Mexico stood at 468 248 t the exported volume was 102 631 tons, with which the value of the export coefficient was 21.9% (Figure 5 and 6), indicating that a good part of the production was destined for the external market (FAOSTAT, 2019).
Figure 5. Strawberry production and export in Mexico, 1994-2016. Prepared with data from FAOSTAT (2019).
Figure 6. Export coefficient of strawberry from Mexico, 1994-2016. Prepared with data from FAOSTAT (2019).
In the period from 1994 to 2016, Spain’s export coefficient was on average 75.3%, the United States of America 9%, and Mexico 27.2% (FAOSTAT, 2019). The values of the indices reflect export specialization from Spain, Mexico and the United States of America, coinciding with the results obtained for Mexico from other similar studies (Ayvar and González, 2011).
Spain, the first strawberry exporter worldwide, during the period from 1994 to 2016 had an index of relative export advantage with values greater than one, which places it as the country with the highest degree of specialization and the highest competitiveness in strawberry exports, in 1994 the IVRE value was 1.105 and in 2016 1.09, with a slightly decreasing trend, preserving the country position with the highest relative advantage of strawberry exports (Figure 7).
Figure 7. Index of relative advantage of strawberry exports, 1994-2016. Spain. prepared with data from FAOSTAT (2019); FAS-USDA (2019).
As for the revealed comparative advantage index, the maximum value was reached in 1994 with 6.1 and later it fell in 2015 to 2.93 and in 2016 to 2.86; however, despite showing a decreasing trend in the IVCR (Figure 8).
Figure 8. Strawberry revealed comparative advantage index, 1994-2016. Spain. Prepared with data from FAOSTAT (2019); FAS-USDA (2019).
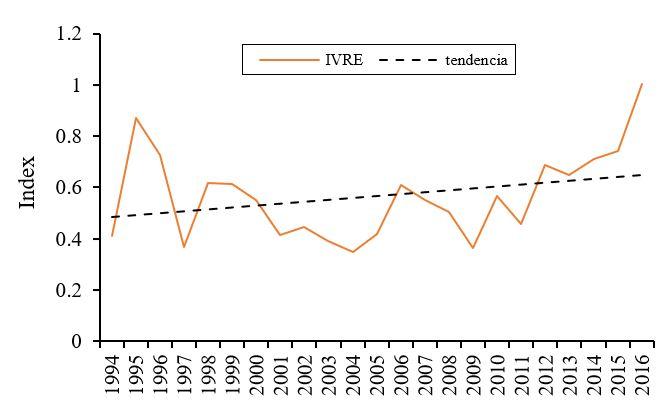
The values shown by Spain are higher than those of the United States of America and Mexico. Spain is the country with the highest competitiveness and the most specialization in strawberry exports, in the strawberry market internationally. The relative advantage index of strawberry exports produced in the United States of America in 1994 was 0 and in 2016 of 0.45433, which had greater relevance from 2004 to 2016.
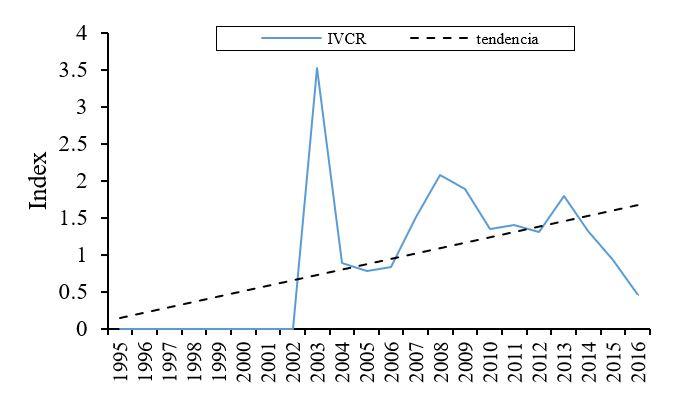
Where the IVRE values ranged from 0.0108 to 0.3339, which maintained an increasing trend, indicating that the strawberry produced in the United States of America is increasingly competitive internationally, with increasing exports and degree of export specialization (Figure 9). In the case of the IVCR of the US strawberry it shows a greater variation, in 2003 it had the highest value with 3.51 and in 2016 the value reached was 0.45 (Figure 10), which indicates that it has a level of competitiveness and degree of specialization in decreasing strawberry exports in the international market.
Figure 9. Strawberry export relative advantage index, 1994-2016. United States of America. prepared with data from FAOSTAT (2019); FAS-USDA (2019).
Figure 10. Strawberry revealed comparative advantage index, 1994-2016. United States of America. prepared with data from FAOSTAT (2019); FAS-USDA (2019).
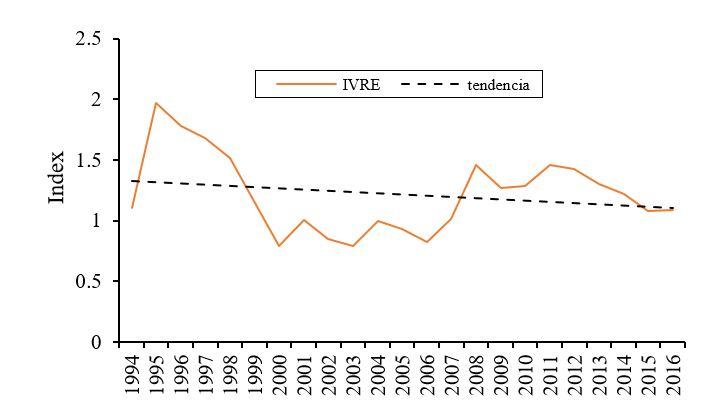
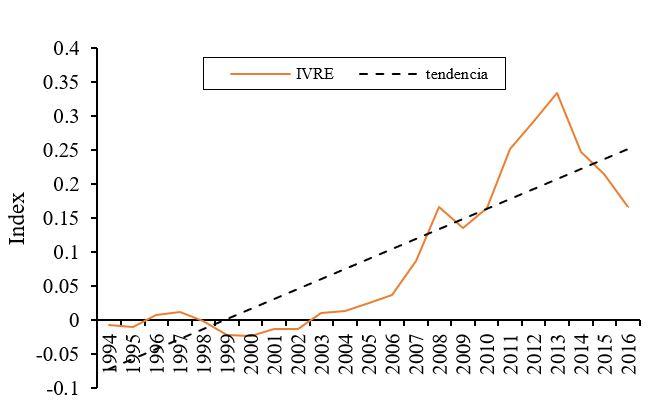
In Mexico, during the period from 1994 to 2016 the strawberry relative export advantage index (IVRE) showed an increasing trend, going from 0.4099 in 1994 to 1.005 in 2016, indicating that the Mexican strawberry has been increasing competitiveness in the external market, in addition the positive values of the IVRE suggest the existence of revealed comparative advantage and specialization in strawberry exports (Figure 11).
Figure 11. Strawberry Export Relative Advantage Index, 1994-2016. Mexico. Prepared with data from FAOSTAT (2019); FAS-USDA (2019).
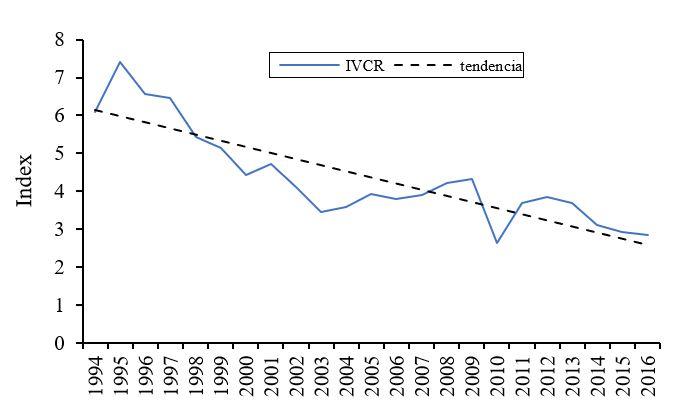
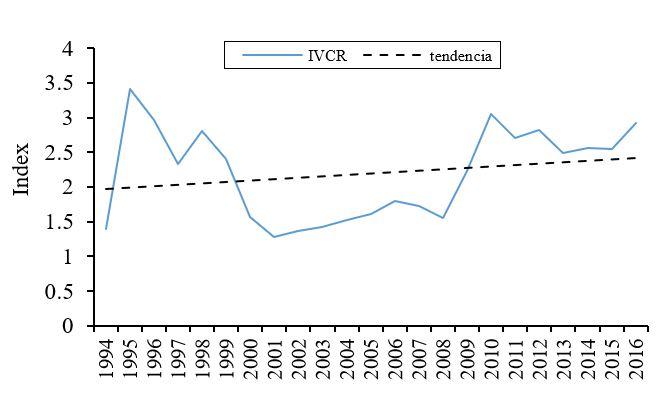
In relation to the IVCR, in 1994 it was 1.387 and in 2016 it was 2.9252, the highest values were in 1995 and 2010 with 3.41 and 3.04 respectively; followed by 1996 with 2.96 and 2016 with 2.92, keeping the IVCR positive values throughout the period (Figure 12).
Figure 12. Strawberry revealed comparative advantage index, 1994-2016. Mexico. Prepared with data from FAOSTAT (2019); FAS-USDA (2019).
Therefore, the Mexican strawberry is a product with revealed comparative advantage, with exports higher than imports. During the period from 1994 to 2016, the IVCR values were greater than one, with an increasing trend, reflecting Mexico’s positive and competitive performance in the foreign market, with growth opportunity, taking advantage of the comparative advantage that the Mexican strawberry has in the international market.
The relative export advantage and revealed comparative advantage indices indicate that there is export specialization and comparative advantage in strawberry exports in the following order: Spain, Mexico and the United States of America, reinforcing and updating other studies carried out on the product (Ayvar and González, 2011).
Conclusions
The results obtained with the application of the competitiveness and revealed comparative advantage indices, made it possible to meet the objective of identifying the competitiveness of strawberry exports in the export market and to accept the hypothesis that the competitiveness and revealed comparative advantage indices of Mexican strawberry exports are positive and growing. The largest strawberry exporters in the world are Spain, the United States of America and Mexico. The quantities and growth rates of strawberry exports from Spain, the United States of America and Mexico from 1994 to 2016 were increasing, reflecting expansion and competitiveness of the product.
On the other hand, the positive export advantage or relative advantage indexes or coefficient, greater than zero, reflects on the one hand, that the three countries have surplus production that is destined for export and, on the other hand, the values of the export and relative export advantage indexes reflect that Spain and Mexico export a greater proportion and the United States of America. A lower proportion of production, highlighting a greater strawberry export specialization from Spain and Mexico and a lower strawberry export specialization from the United States of America, which allocates more than ninety percent of production to the domestic market. Likewise, the
positive revealed comparative advantage indexes, greater than zero, reflect that the three countries are competitive and have revealed comparative advantage, with Spain being the most competitive, followed by Mexico and finally by the United States of America.
The positive growth rates of production and exports, and the positive competitiveness and revealed comparative advantage indexes of exports, reflect that strawberry production and export is expanding, is competitive and has revealed comparative advantage in Spain, Mexico and United States of America, so it is advisable to expand the crop, increase production and increase exports.
Cited literature
Arias, J. y Segura, O. 2004. Índice de ventaja comparativa revelada: un indicador del desempeño y de la competitividad productivo-comercial de un país. Instituto Interamericano de Cooperación para la Agricultura. Costa Rica. 10 p.
Avendaño, B. D. 2008. Globalización y competitividad en el sector hortofrutícola: México, el gran perdedor. México. El Cotidiano. 147:91-98.
Ávila, A. y González, D. de J. 2012. La competitividad de las fresas (Fragaria spp.) mexicanas en el mercado nacional, regional y de Estados Unidos. México. Agricultura, Sociedad y Desarrollo. 9(1):17-27.
Ayvar, F. J. y González, J. 2011. Competitividad revelada del sector agrícola mexicano: El caso de la fresa. In: La competitividad como factor de éxito. Sánchez, J.; Gaytán, J. y Vázquez, M. (coords), 1ra ed. Red Internacional de Investigadores en Competitividad. Guadalajara, México. 167-186 pp.
Ayvar, F. J.; Navarro, J. C. L. y Delfín, O. V. 2018. Competitividad y productividad del sector agropecuario mexicano en APEC, 1980-2015. México. Portes. Revista Mexicana de Estudios sobre la Cuenca del Pacífico. 12(23):7-30.
Balassa, B. (1965). “Trade liberalization and revealed comparative advantage”. The Manchester School of Economics and Social Studies. 33(2):92-123. https://doi.org/10.1111/j.1467-9957.1965.tb00050.x.
Chordi, S. 2013. Contenido fenólico y capacidad antioxidante de fresa mínimamente procesada sometida a tratamientos de conservación por pulsos de luz de alta intensidad. Tesis. Facultad de Medicina, Universidad de Lleida, España. 45 p.
Contreras, J. M. 1999. La competitividad de las exportaciones mexicanas de aguacate: un análisis cuantitativo. México. Revista Chapingo Serie Horticultura. 5(Especial):393-400.
Daza, L. G. 2014. Determinación de la competitividad en países de América Latina: aplicación de un nuevo método. México. Perfiles Latinomericanos. 22(44):219-234.
De Pablo, J. y Giacinti, M. A. 2011. Competitividad en el comercio internacional vs ventajas comparativas reveladas (VCR): ensayo sobre exportaciones de manzanas de América del Sur. México. Revista Mexicana de Economía Agrícola y de los Recursos Naturales (REMECAREN). 6(1):49-82.
FAOSTAT. 2019. The statistics division of the Food and Agriculture Organization of the United Nations: http://faostat3.fao.org/faostat-gateway/go/to/download/T/TP/S.
FAS-USDA. 2019. Foreign Agricultural Service-United States Department of Agriculture. http://www.fas.usda.gov/.
González, R. 2017. Competitividad de las exportaciones: un análisis teórico de indicadores de ventajas comparativas reveladas y su aplicación a los datos de comercio de Paraguay. Documento de trabajo N. 1. Subsecretaria de Estado de Economía, Ministerio de Hacienda. Paraguay. 35 p.
Heredia, J. y Huarachi, J. 2009. El índice de la ventaja comparativa revelada (VCR) entre el Perú y los principales exportadores del mundo. El caso de la Región Lambayeque. Perú. Journal of Economics, Finance and Administrative Science. 14(26):27-55.
Mortimore, M.; Bonifaz, J. L. y Duarte de Oliveira, J. L. 1997. La competitividad internacional: un análisis de las experiencias de Asia en desarrollo y América Latina. Naciones Unidas División de Desarrollo Productivo y Empresarial. Santiago de Chile. 69 p.
OCDE (Organisation for Economic Co-operation and Development). 1992. Technology and the Economy. The Key Relationships. OCDE. The Technology/Economy Programme 42. 328 p.
Restrepo, A.M.; Cortés, M. y Rojano, B. 2009. Determinación de la vida útil de fresa (Fragaria ananassa duch.) fortificada con vitamina E. Colombia. DYNA. 76(159):163-175.
Salazar, J. J. 2015. Estructura y evolución reciente de las ventajas comparativas de México y de sus estados. México. Revista de Ciencias Sociales de la Universidad Autónoma de Nuevo León. TRAYECTORIAS. 17(40):67-88.
Vargas, H. 2014. Desempeño competitivo de productos agropecuarios de Guatemala: una evaluación con base en las ventajas comparativas reveladas por el comercio internacional de 2000 a 2010. San José, Costa Rica. Instituto Interamericano de Cooperación para la Agricultura (IICA). 39 p.
Vollrath, T. 1991. A theoretical evaluation of alternative trade intensity measures of revealed comparative advantage. Germany. Review of World Economics. Weltwirtschaftliches Archiv. Institut für Weltwirtschaft (Kiel Institute for the World Economy). 127(2):265-280.